From Coal to Solar: Tracking Power With Machine Learning and Satellites
Data Science Festival, June 2020
@LaurenceWWatson
Co-founder at treebeard.io
What I'll cover
- The big picture
- Growth of geospatial data
- Coal -> needs to go
- Solar -> needs to be cheaper and better
- Geospatial ML pipeline with RasterVision
The Big picture
Photo by Vince Gx on Unsplash
Climate change
and net zero
What does that mean?
Glen Peters, CICERO, https://www.cicero.oslo.no/en/posts/climate-news/stylised-pathways-to-well-below-2c
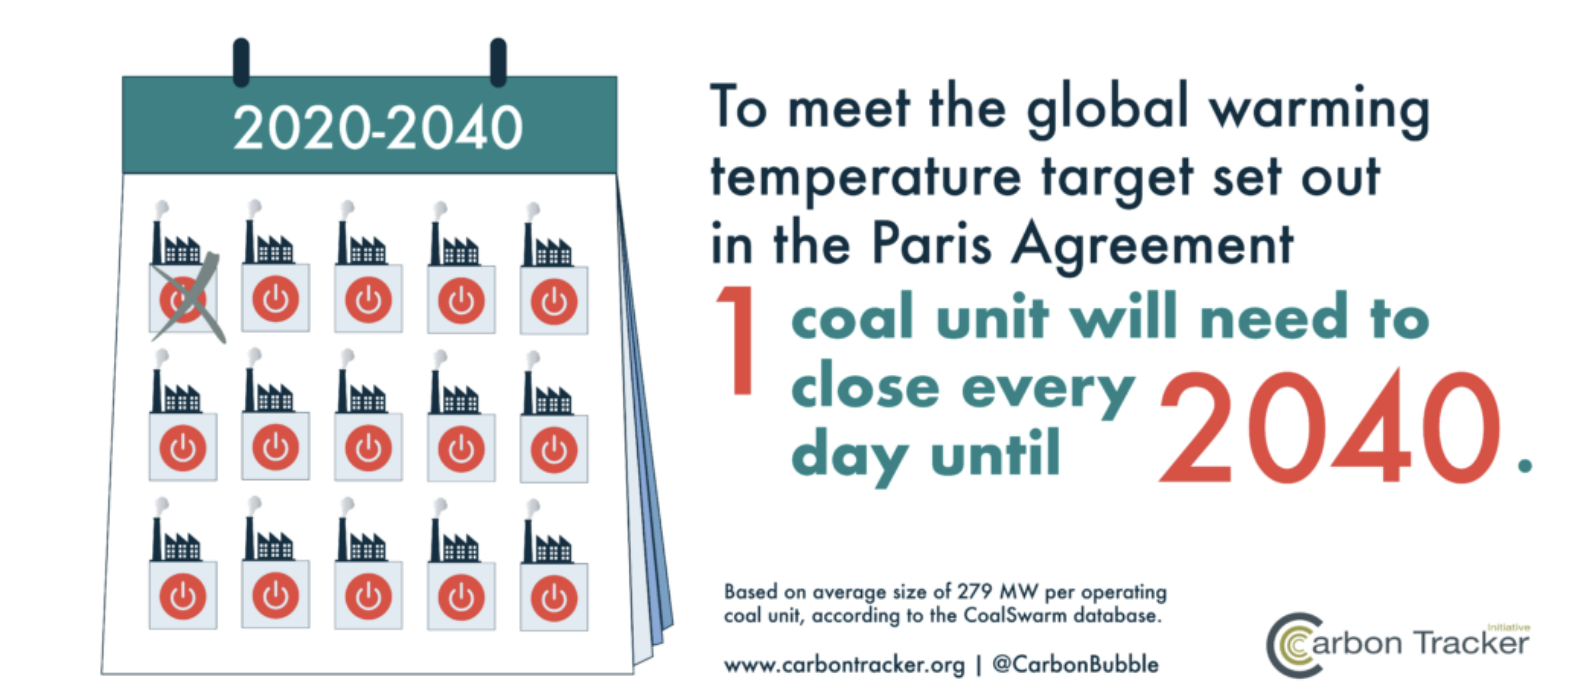
Coal plants worldwide
Coal power for electricity contributed 30% of global CO2 emissions in 2018 (IEA).
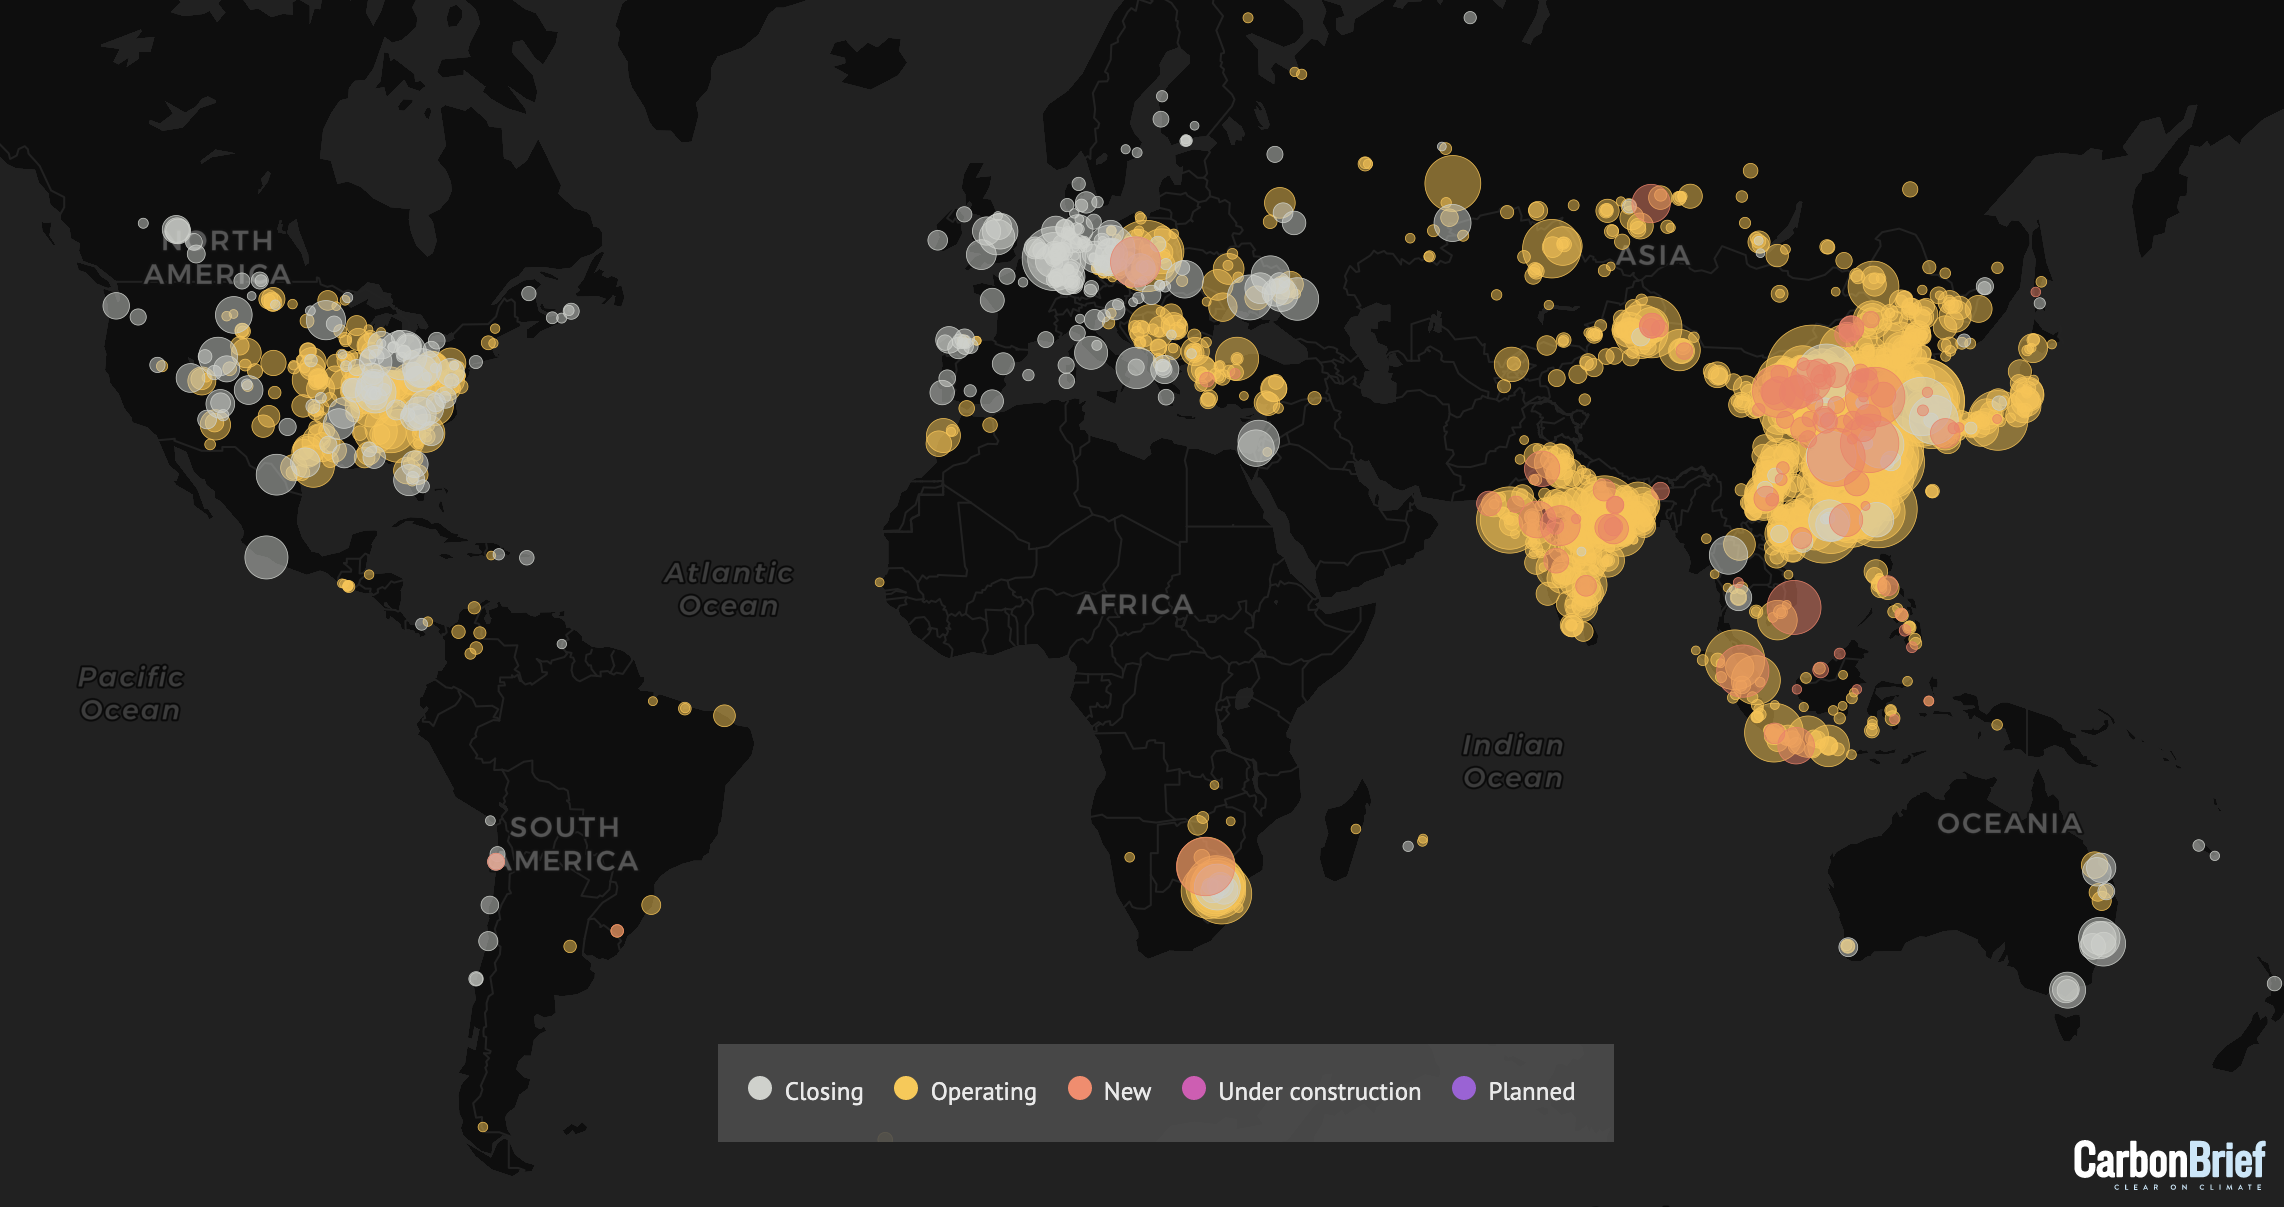
Source: Carbon Brief, https://www.carbonbrief.org/mapped-worlds-coal-power-plants
Power plant data
The World Resources Institute has a great open dataset
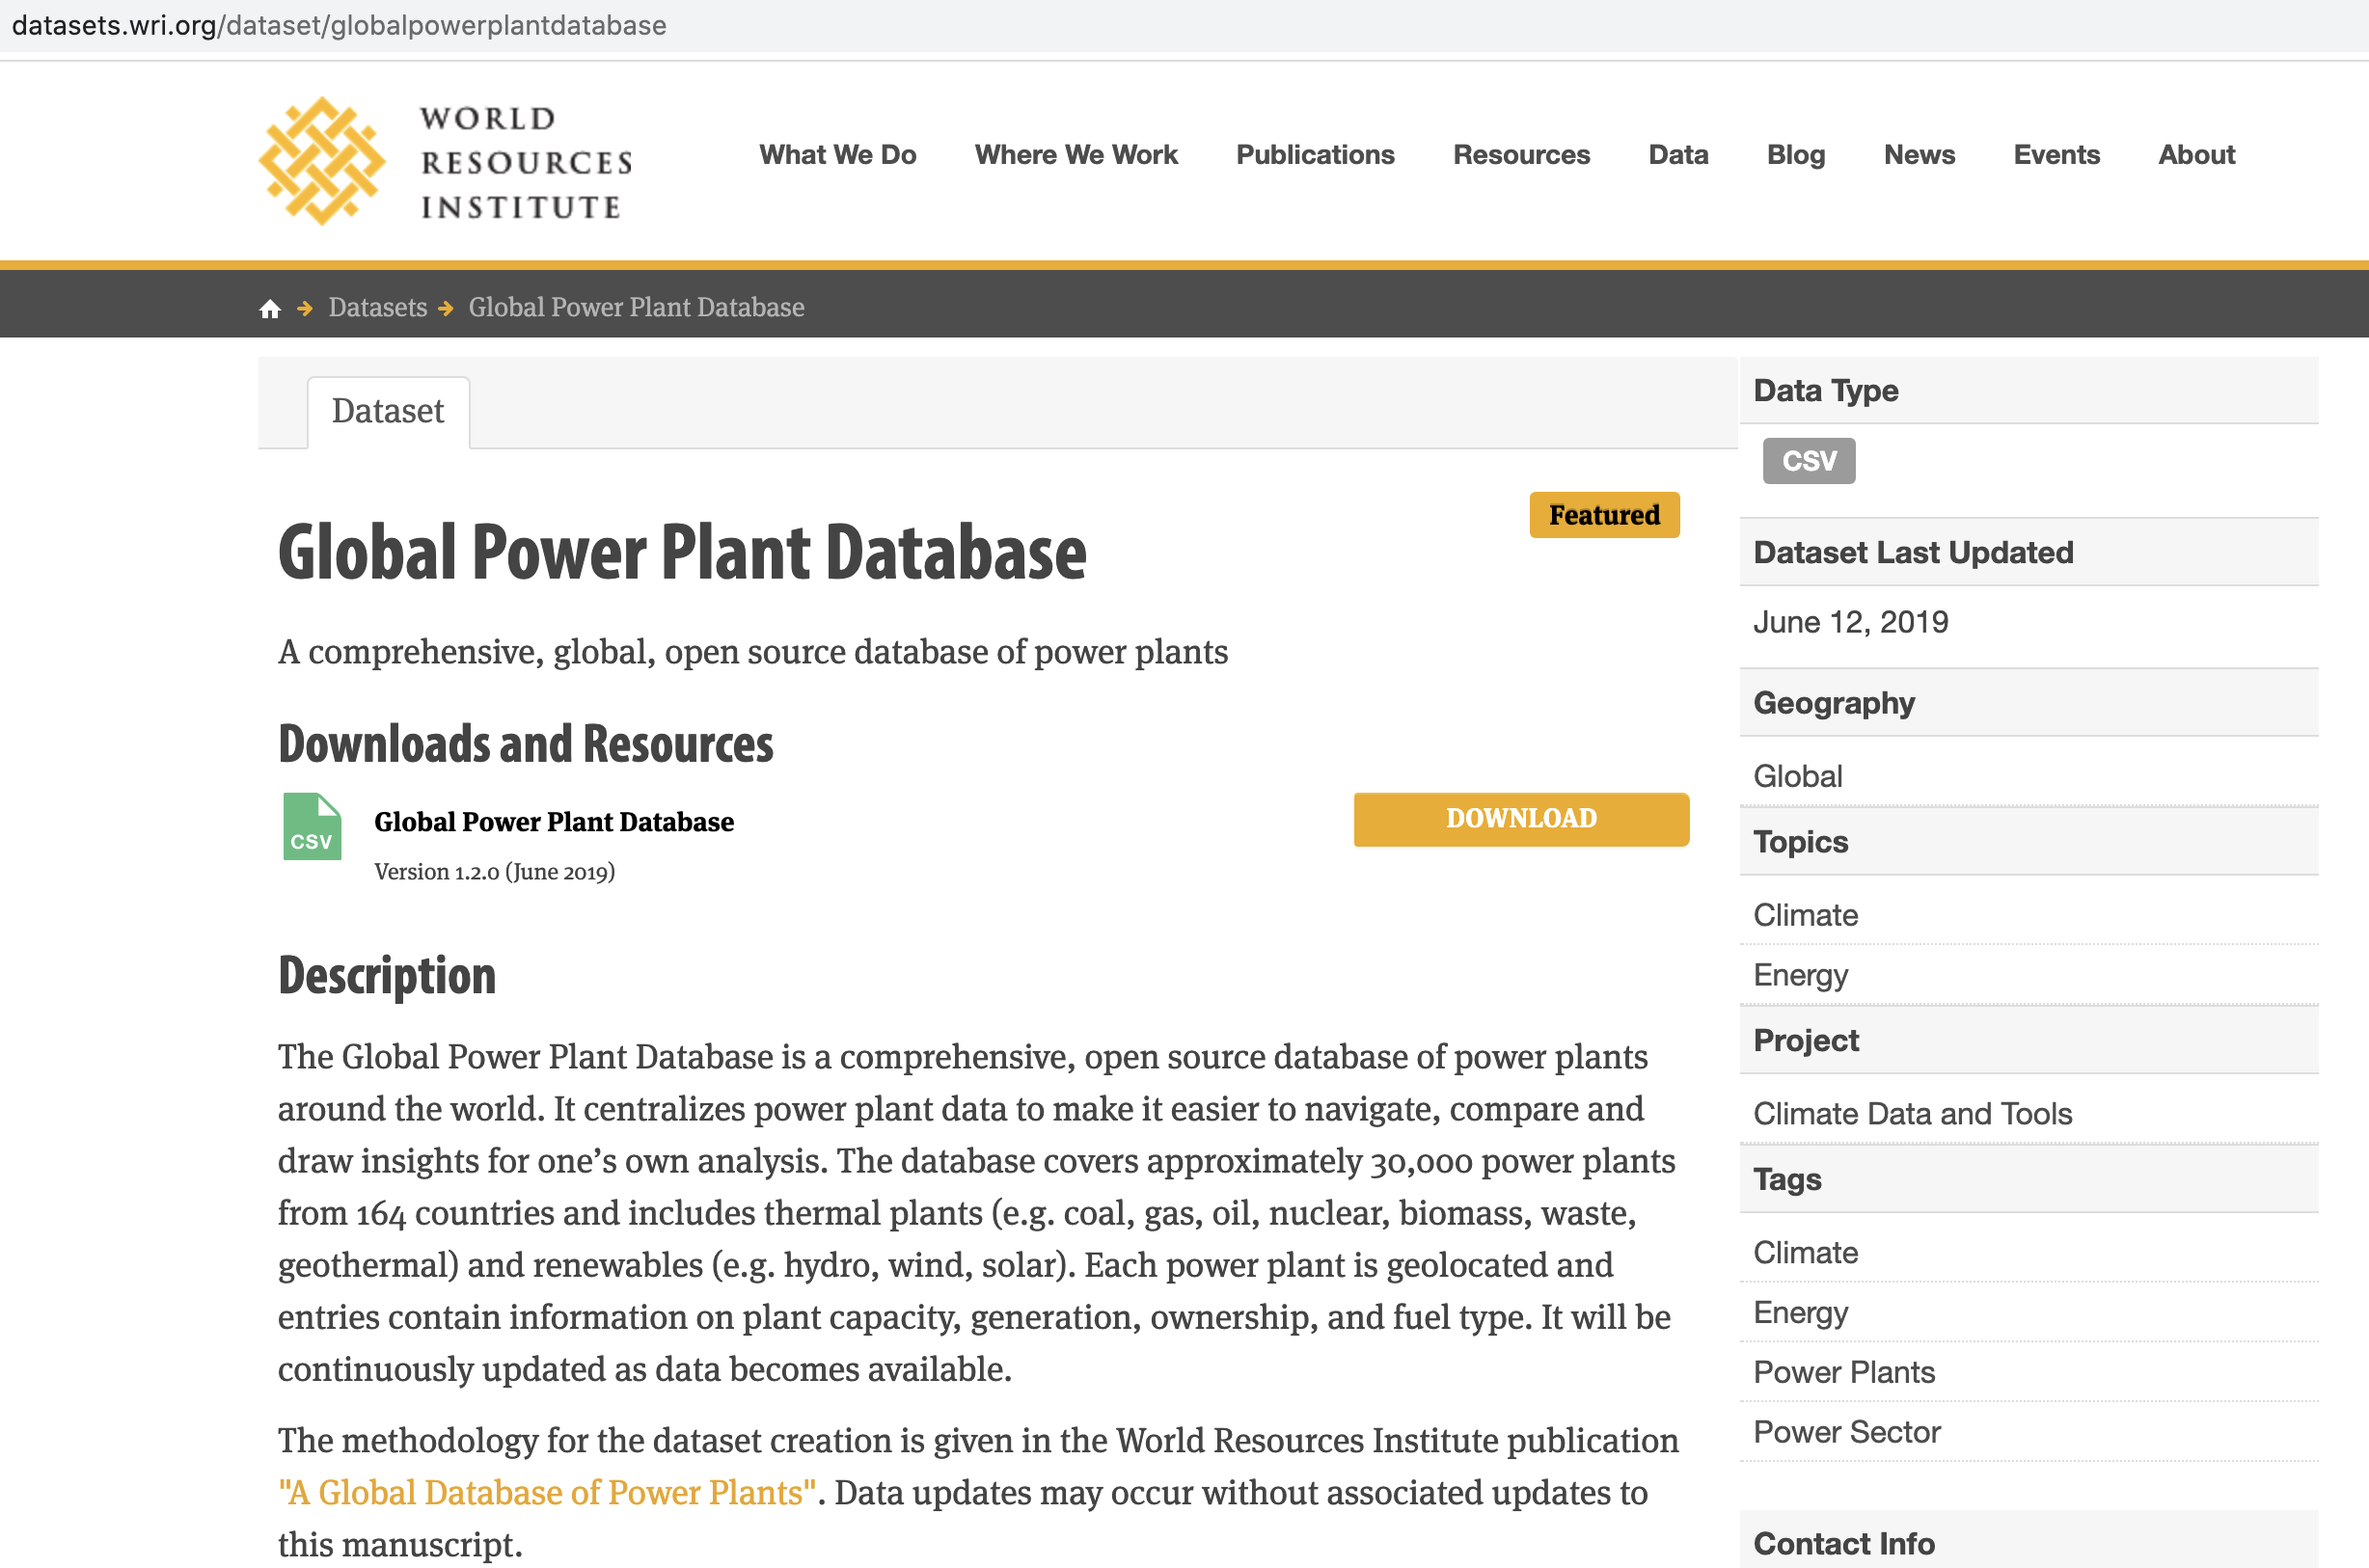
Power plant data
      import pandas as pd
      import matplotlib.pyplot as plt
      sns.set_color_codes("muted")
      sns.set(font_scale=2)

      power_plants = pd.read_csv("talk_data/global_power_plant_database.csv")
      f, ax = plt.subplots(figsize=(12, 8))

      plants = power_plants.groupby('primary_fuel')\
                            .sum()\
                            .sort_values('estimated_generation_gwh', ascending=False)\
                            .reset_index()

      sns.barplot(x="estimated_generation_gwh", y="primary_fuel", data=plants,
                  label="Total", color="b")

      ax.set(ylabel="", xlabel="Estimated Generation 2018 in GWh")
      sns.despine(left=True, bottom=True)
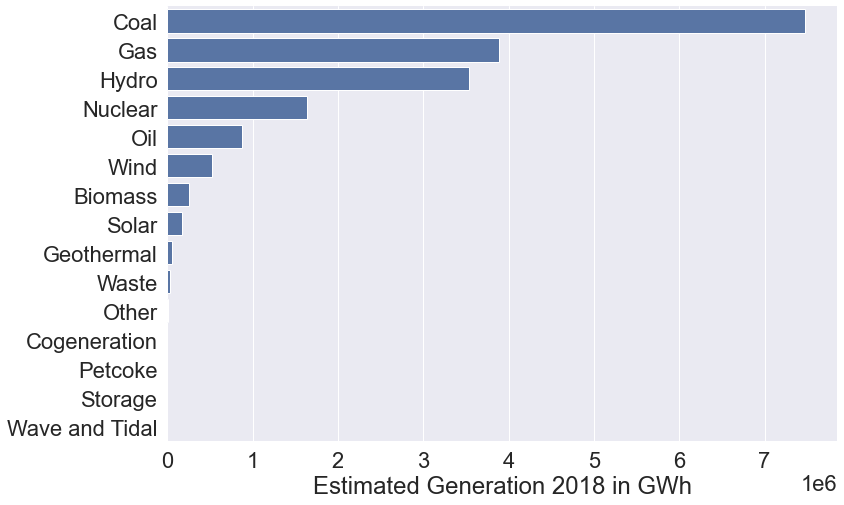
Data: https://datasets.wri.org/dataset/globalpowerplantdatabase
Source: Carbon Tracker Initiative https://carbontracker.org/earth-to-investors/
Solar - part of the solution 🌞🌞🌞
Quiz - how much of UK electricity was generated by solar in the last month?
1-5%, 5-10%, 10-15%, 15-20%
UK solar generated 8.3% of total electricity in the last month, producing 1.69TWh of energy
In the same period last year,
solar generated 6.3%, and 1.39TWh of energy
Source: https://electricinsights.co.uk/
Photo by American Public Power Association on Unsplash
Powering the transition
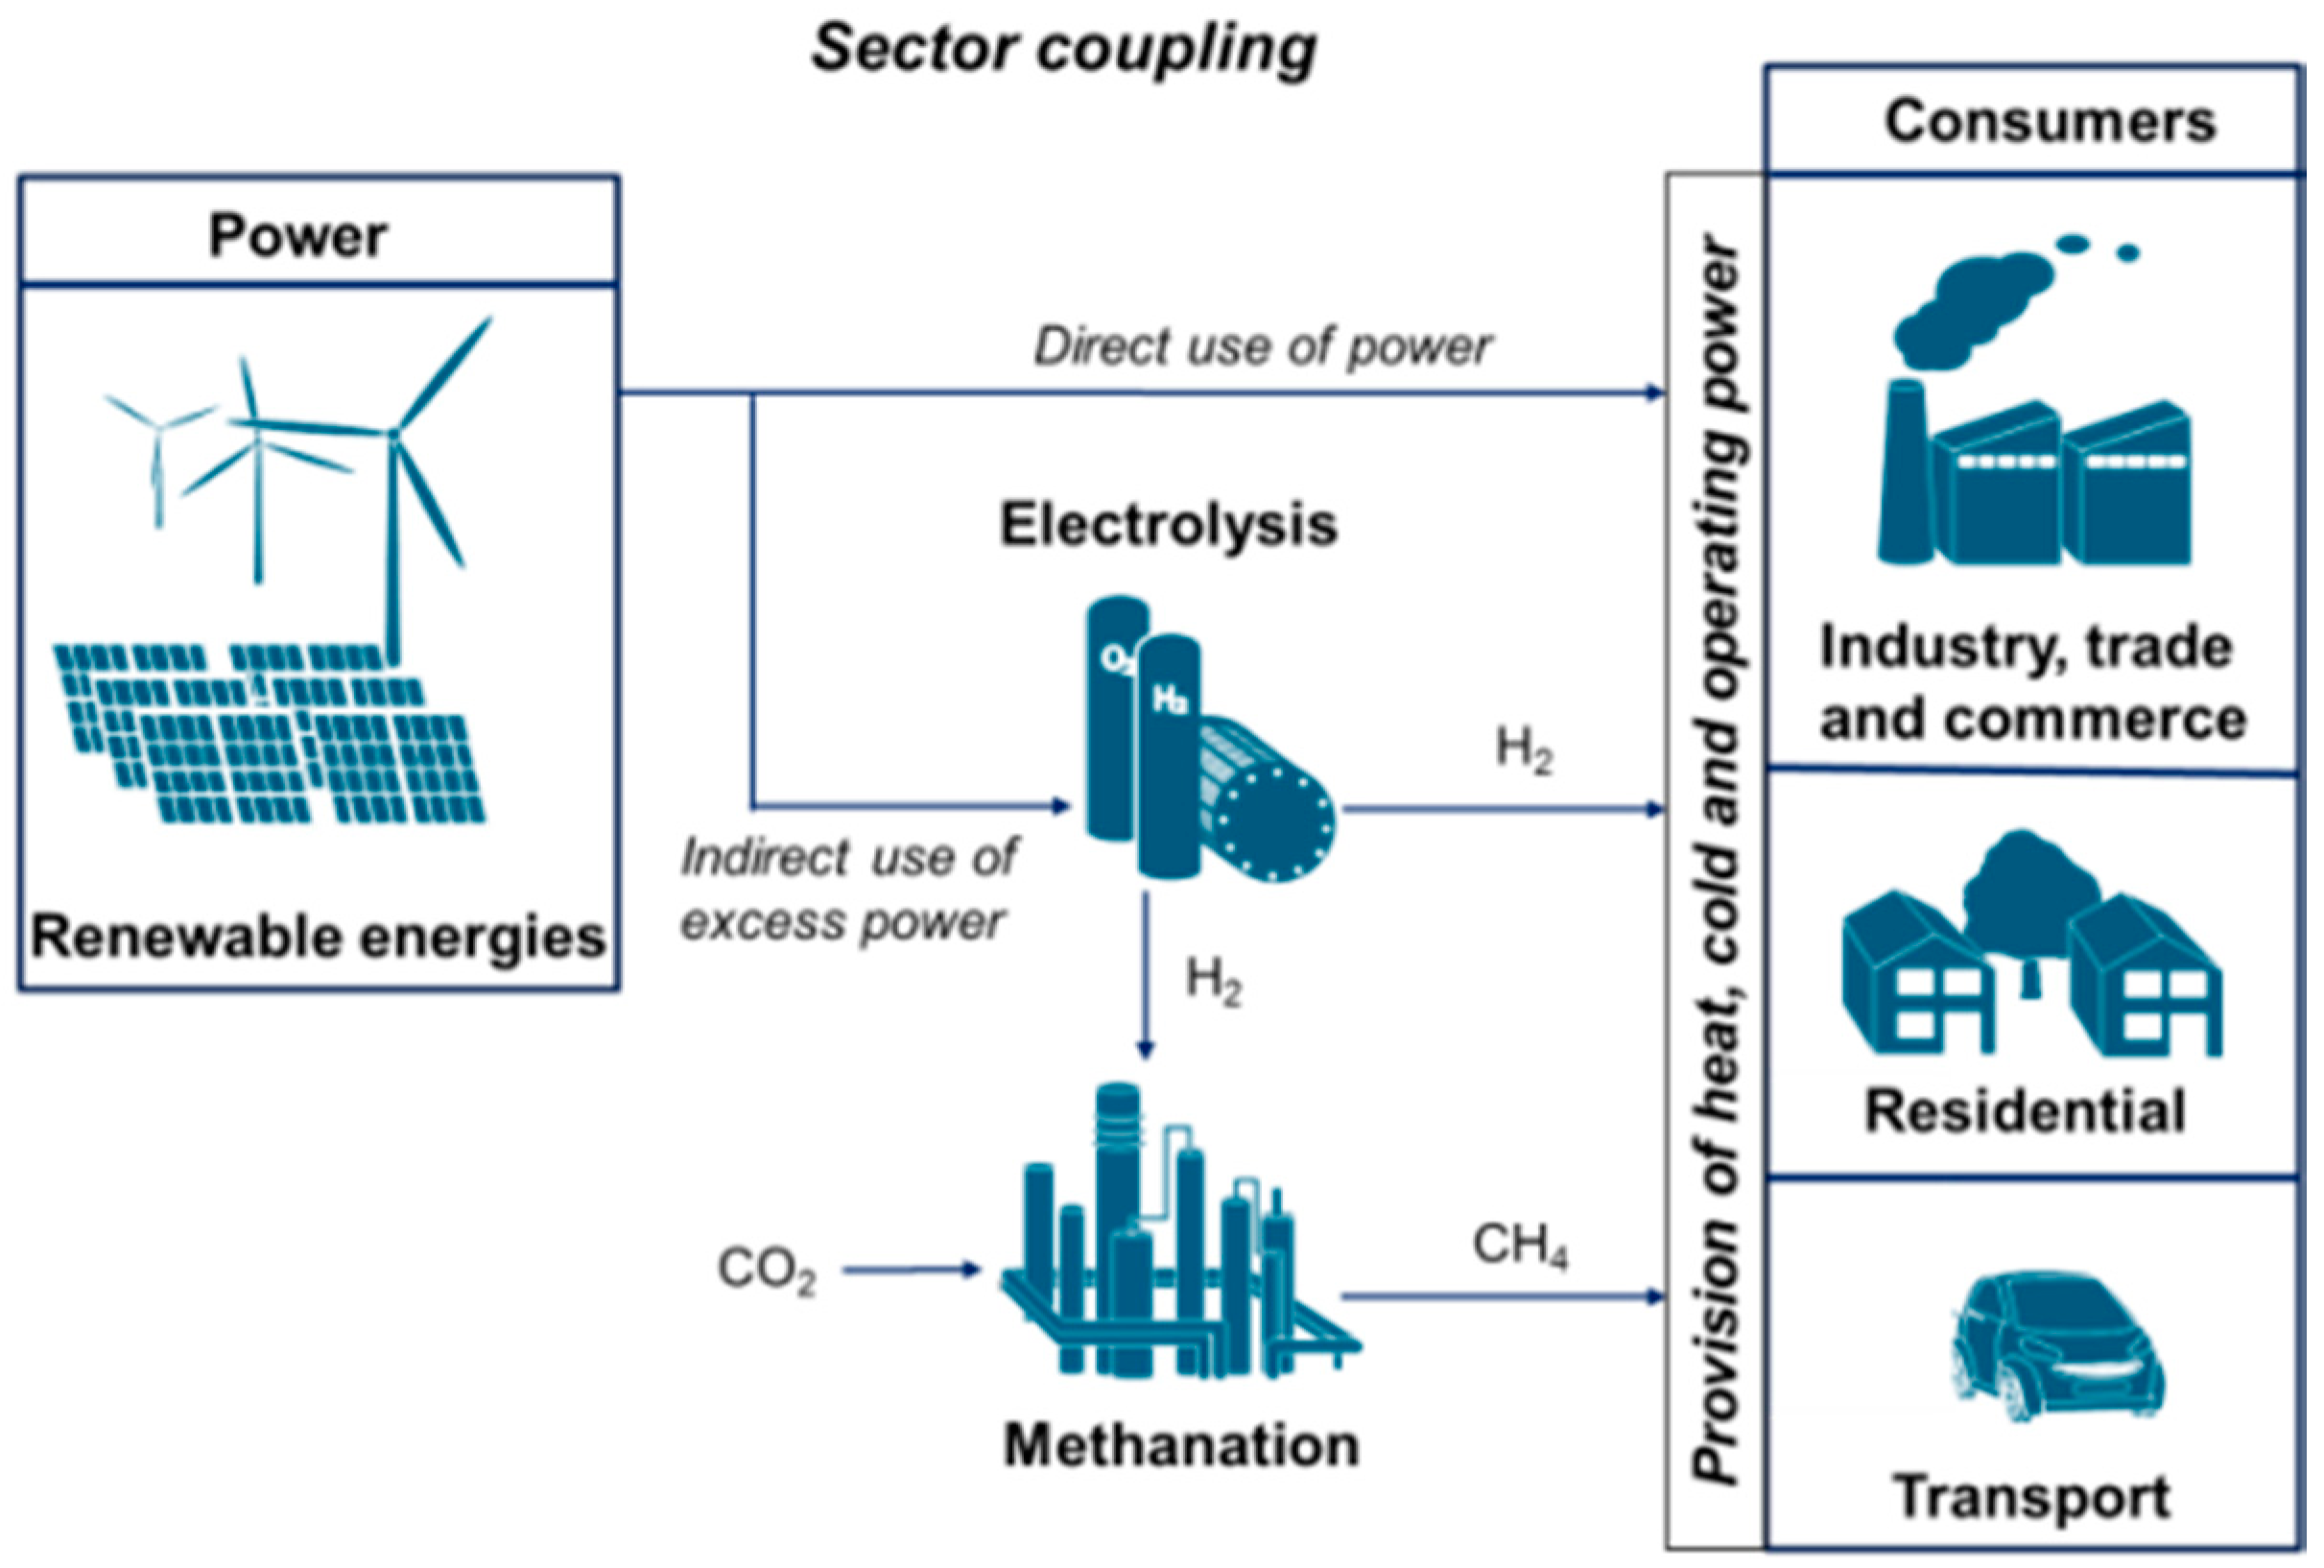
Linking the Power and Transport Sectors—Part 1: The Principle of Sector Coupling, Robinius et al, Energies 2017, 10(7), 956; https://doi.org/10.3390/en10070956
Geospatial Analysis for energy
Geospatial terms
Spatial vs geospatial
Source: Dr Joanna Kuleszo @ UCL
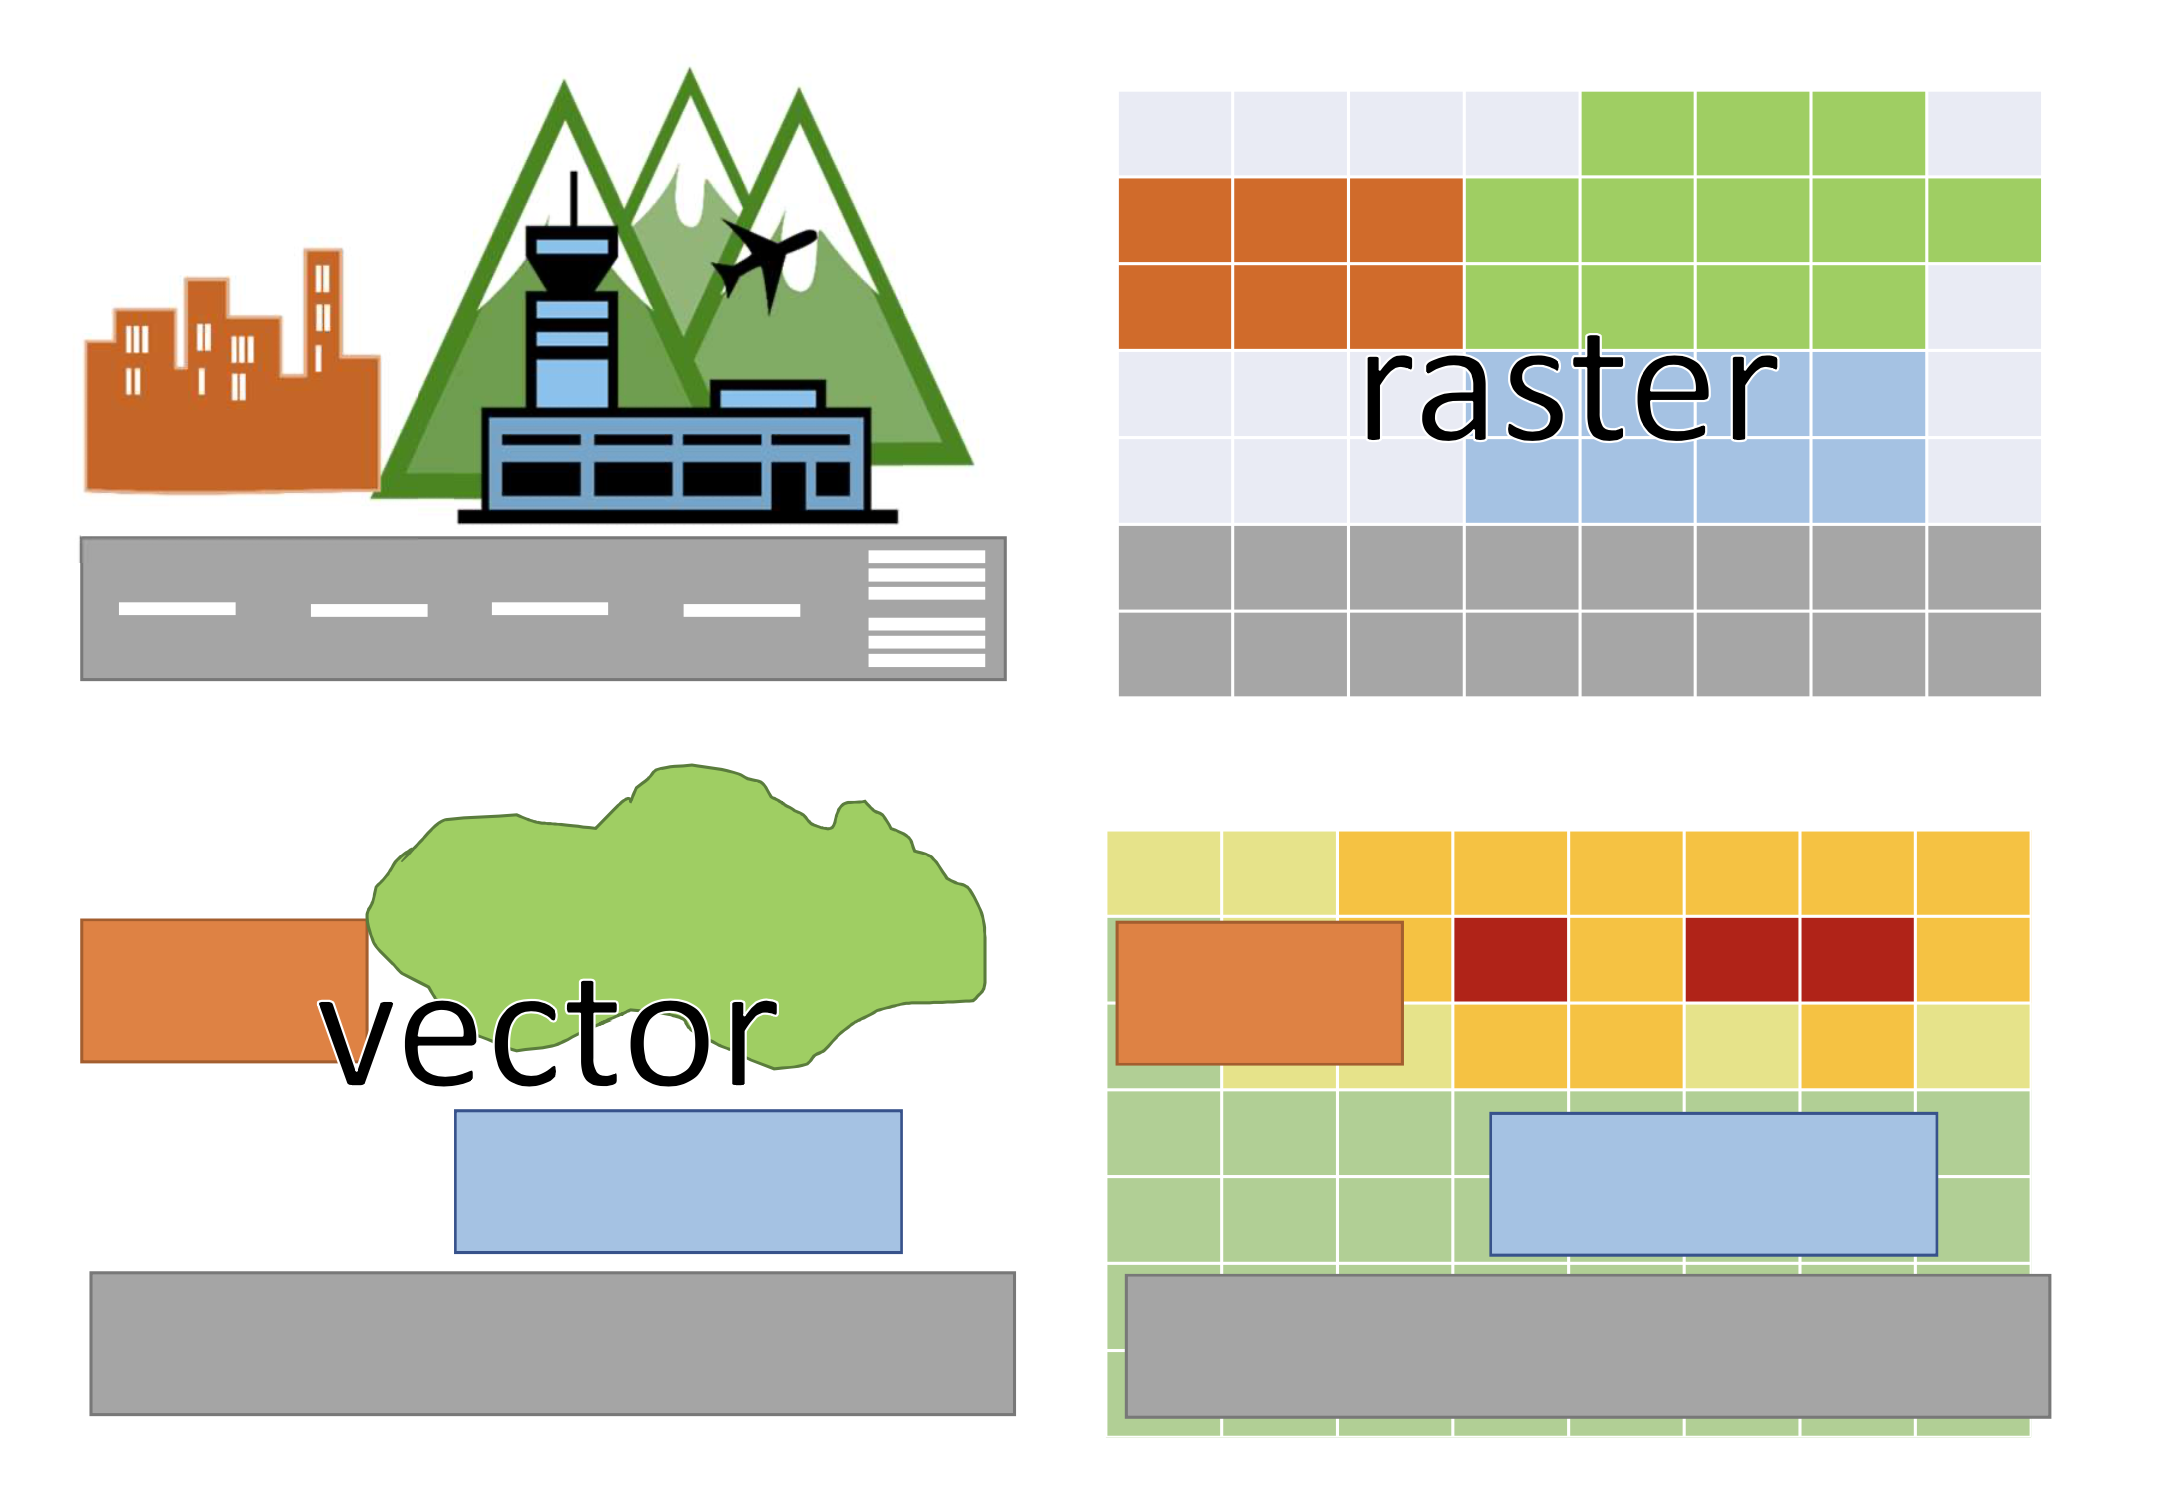
Raster
e.g. *.tif, *.jpg, *.exif, *.png, *.gif
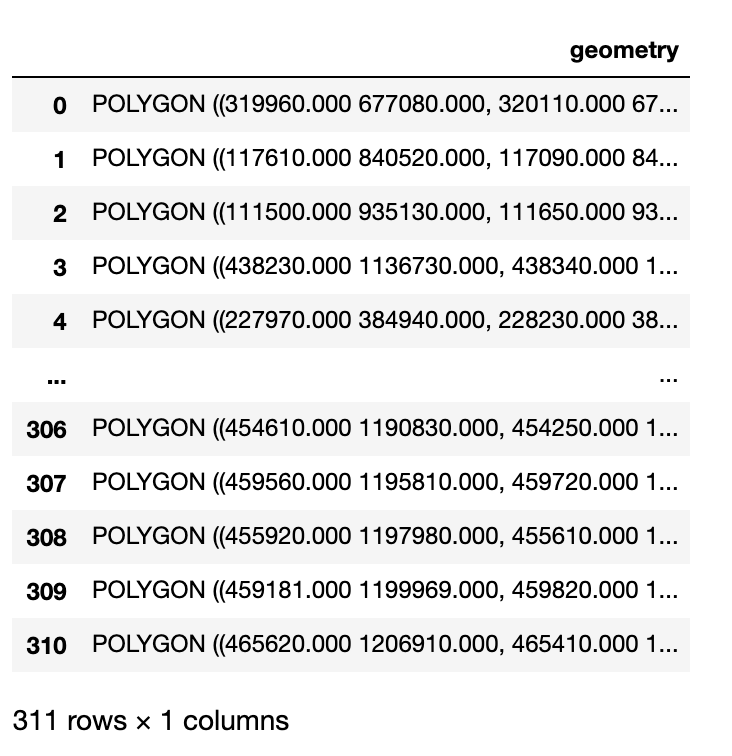
Geospatial Vector
e.g. *.geojson, *.shp, ...
Python tools
Show me the data
Aerial data
Shot from planes.
Now also from drones.
Very high resolution (less than 0.25m per pixel)
Infrequent creation (ie low revisit rate)
Satellite data
Huge growth in availability
Resolution getting better all the time (less than 3m visual band becoming widely available - but paid, 10m visual through Sentinel)
Multi-spectral thanks to many different satellite sensors: good for SOx, NOx, Methane, CO2, etc
Landsat 8, launched 2013
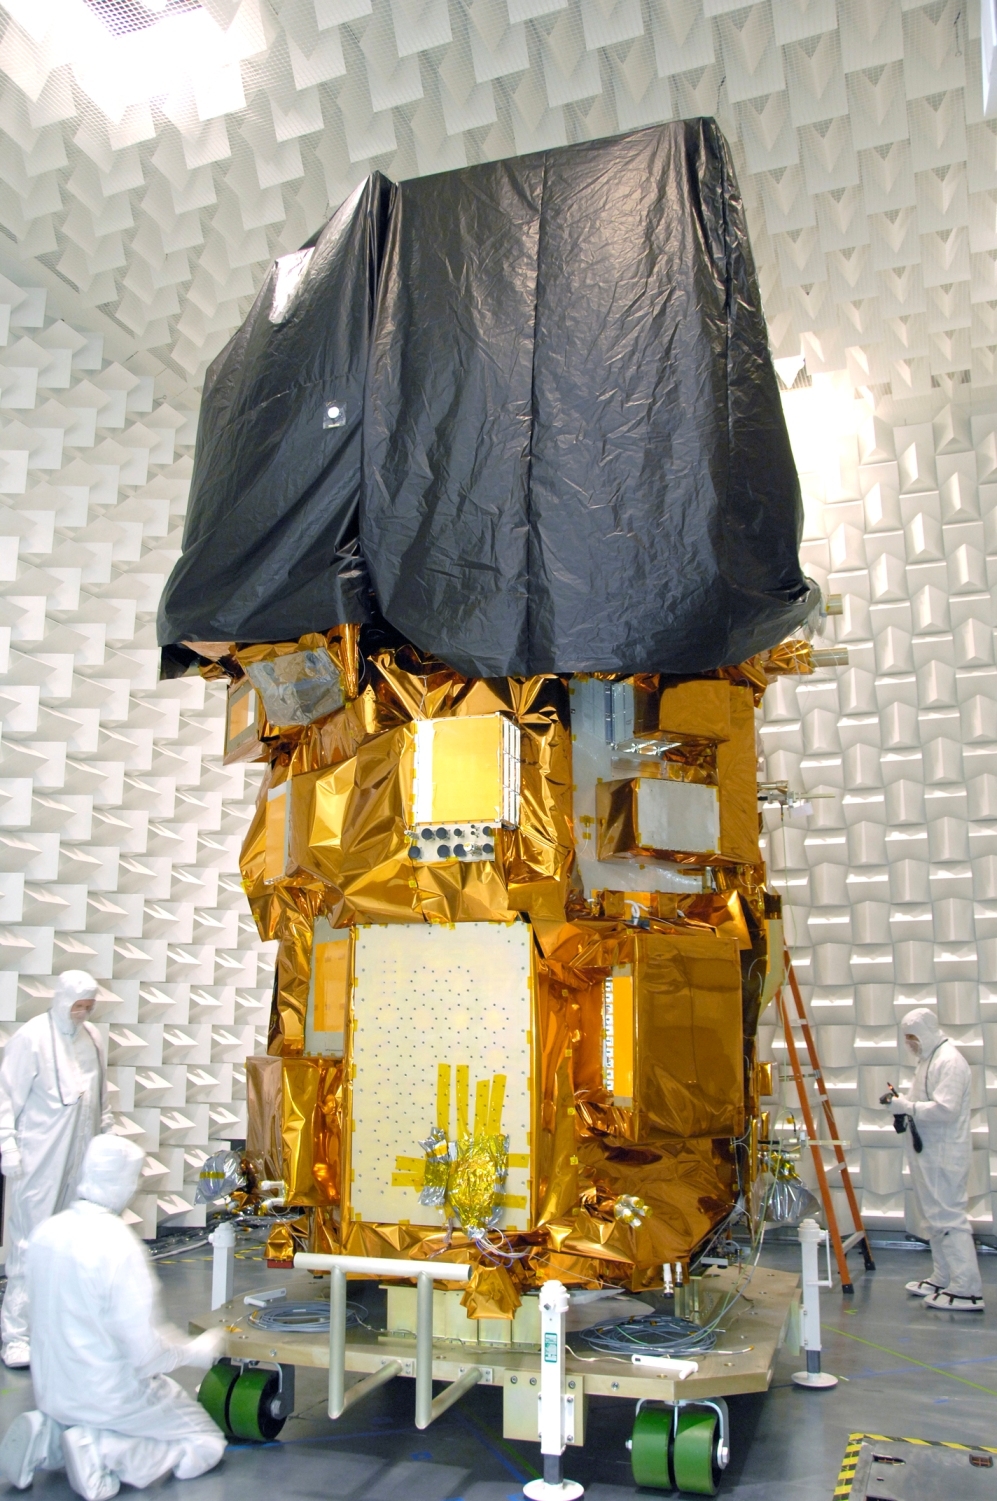
By Orbital Sciences Corporation - http://ldcm.gsfc.nasa.gov/gallery/image_pages/spacecraft/spc0004.html, Public Domain, https://commons.wikimedia.org/w/index.php?curid=21978290
Planet's cubesats,
In 2015, Planet had 92 satellites. In 2017 in launched 88 - the 'dove' constellation, promising 1 day revisit rate - global daily coverage!
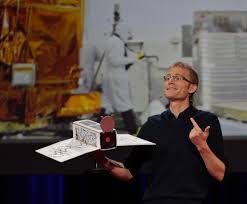
Photo: Planet Labs CEO Will Marshall, credit: Steve Jurvetson
Satellite sensor bands
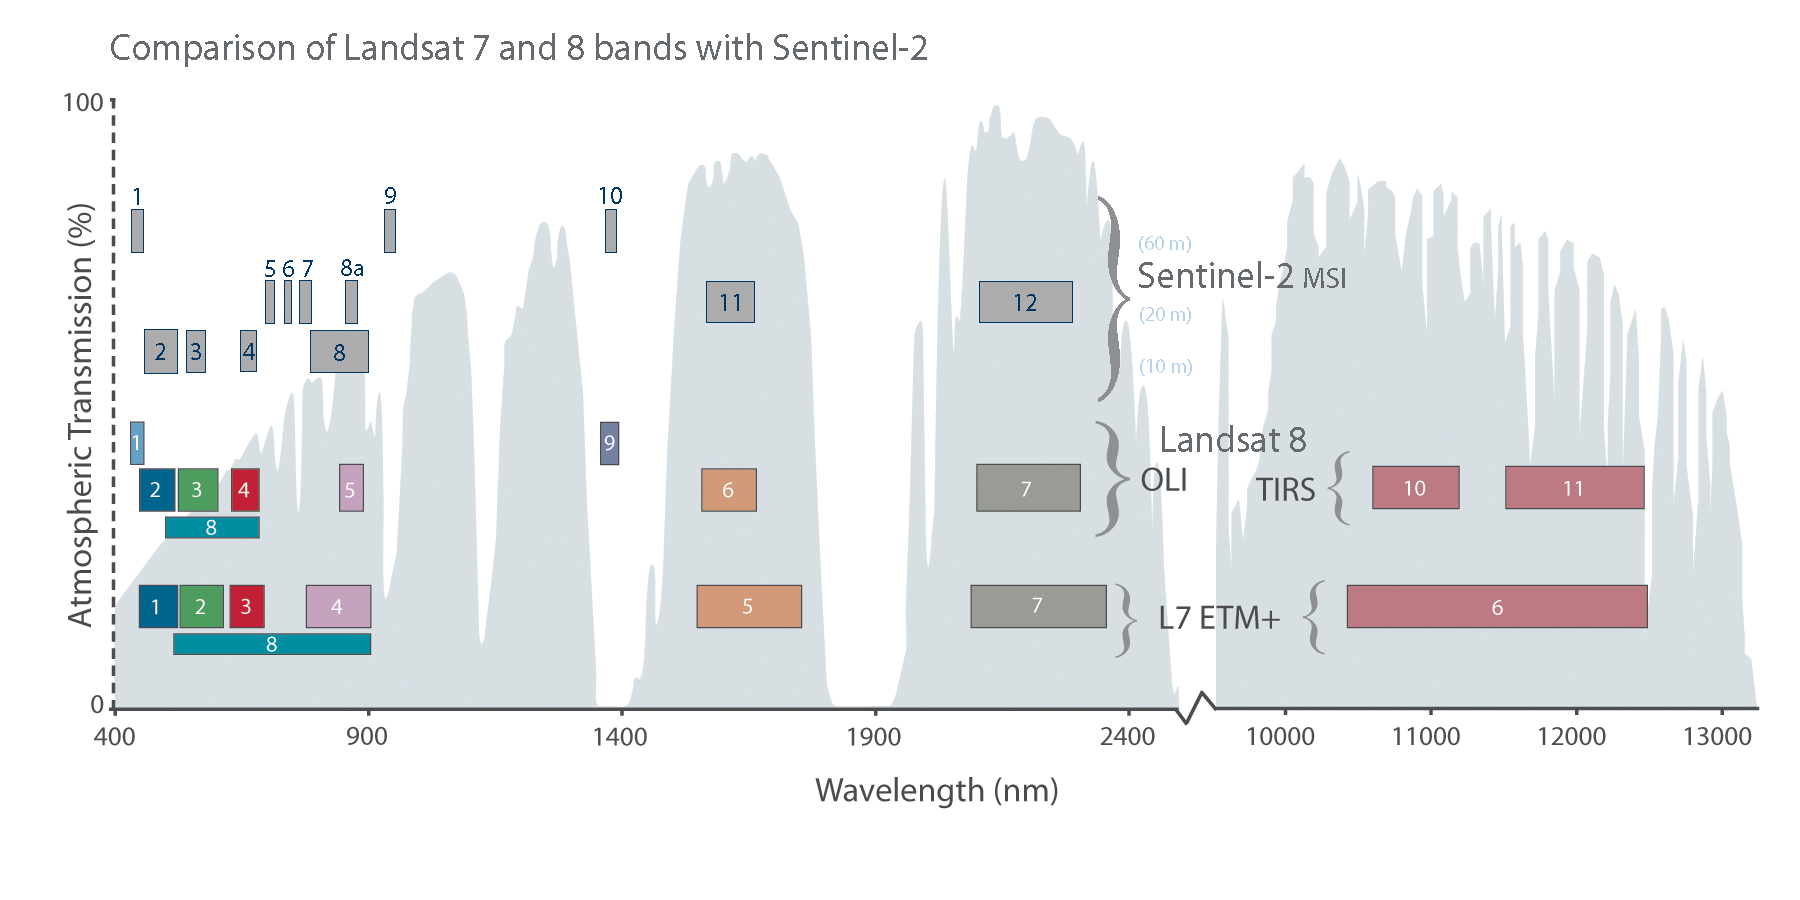
Source: https://landsat.gsfc.nasa.gov/sentinel-2b-successfully-launches/
MONITORING COAL PLANTS
Huai'an power station in Hebei province, 660 MW
Zhangjiakou coal power plant in Hebei province, 2.6 GW
Source: https://qz.com/1419899/satellite-images-reveal-coal-power-is-bad-business-for-china/ via Carbon Tracker via Planet
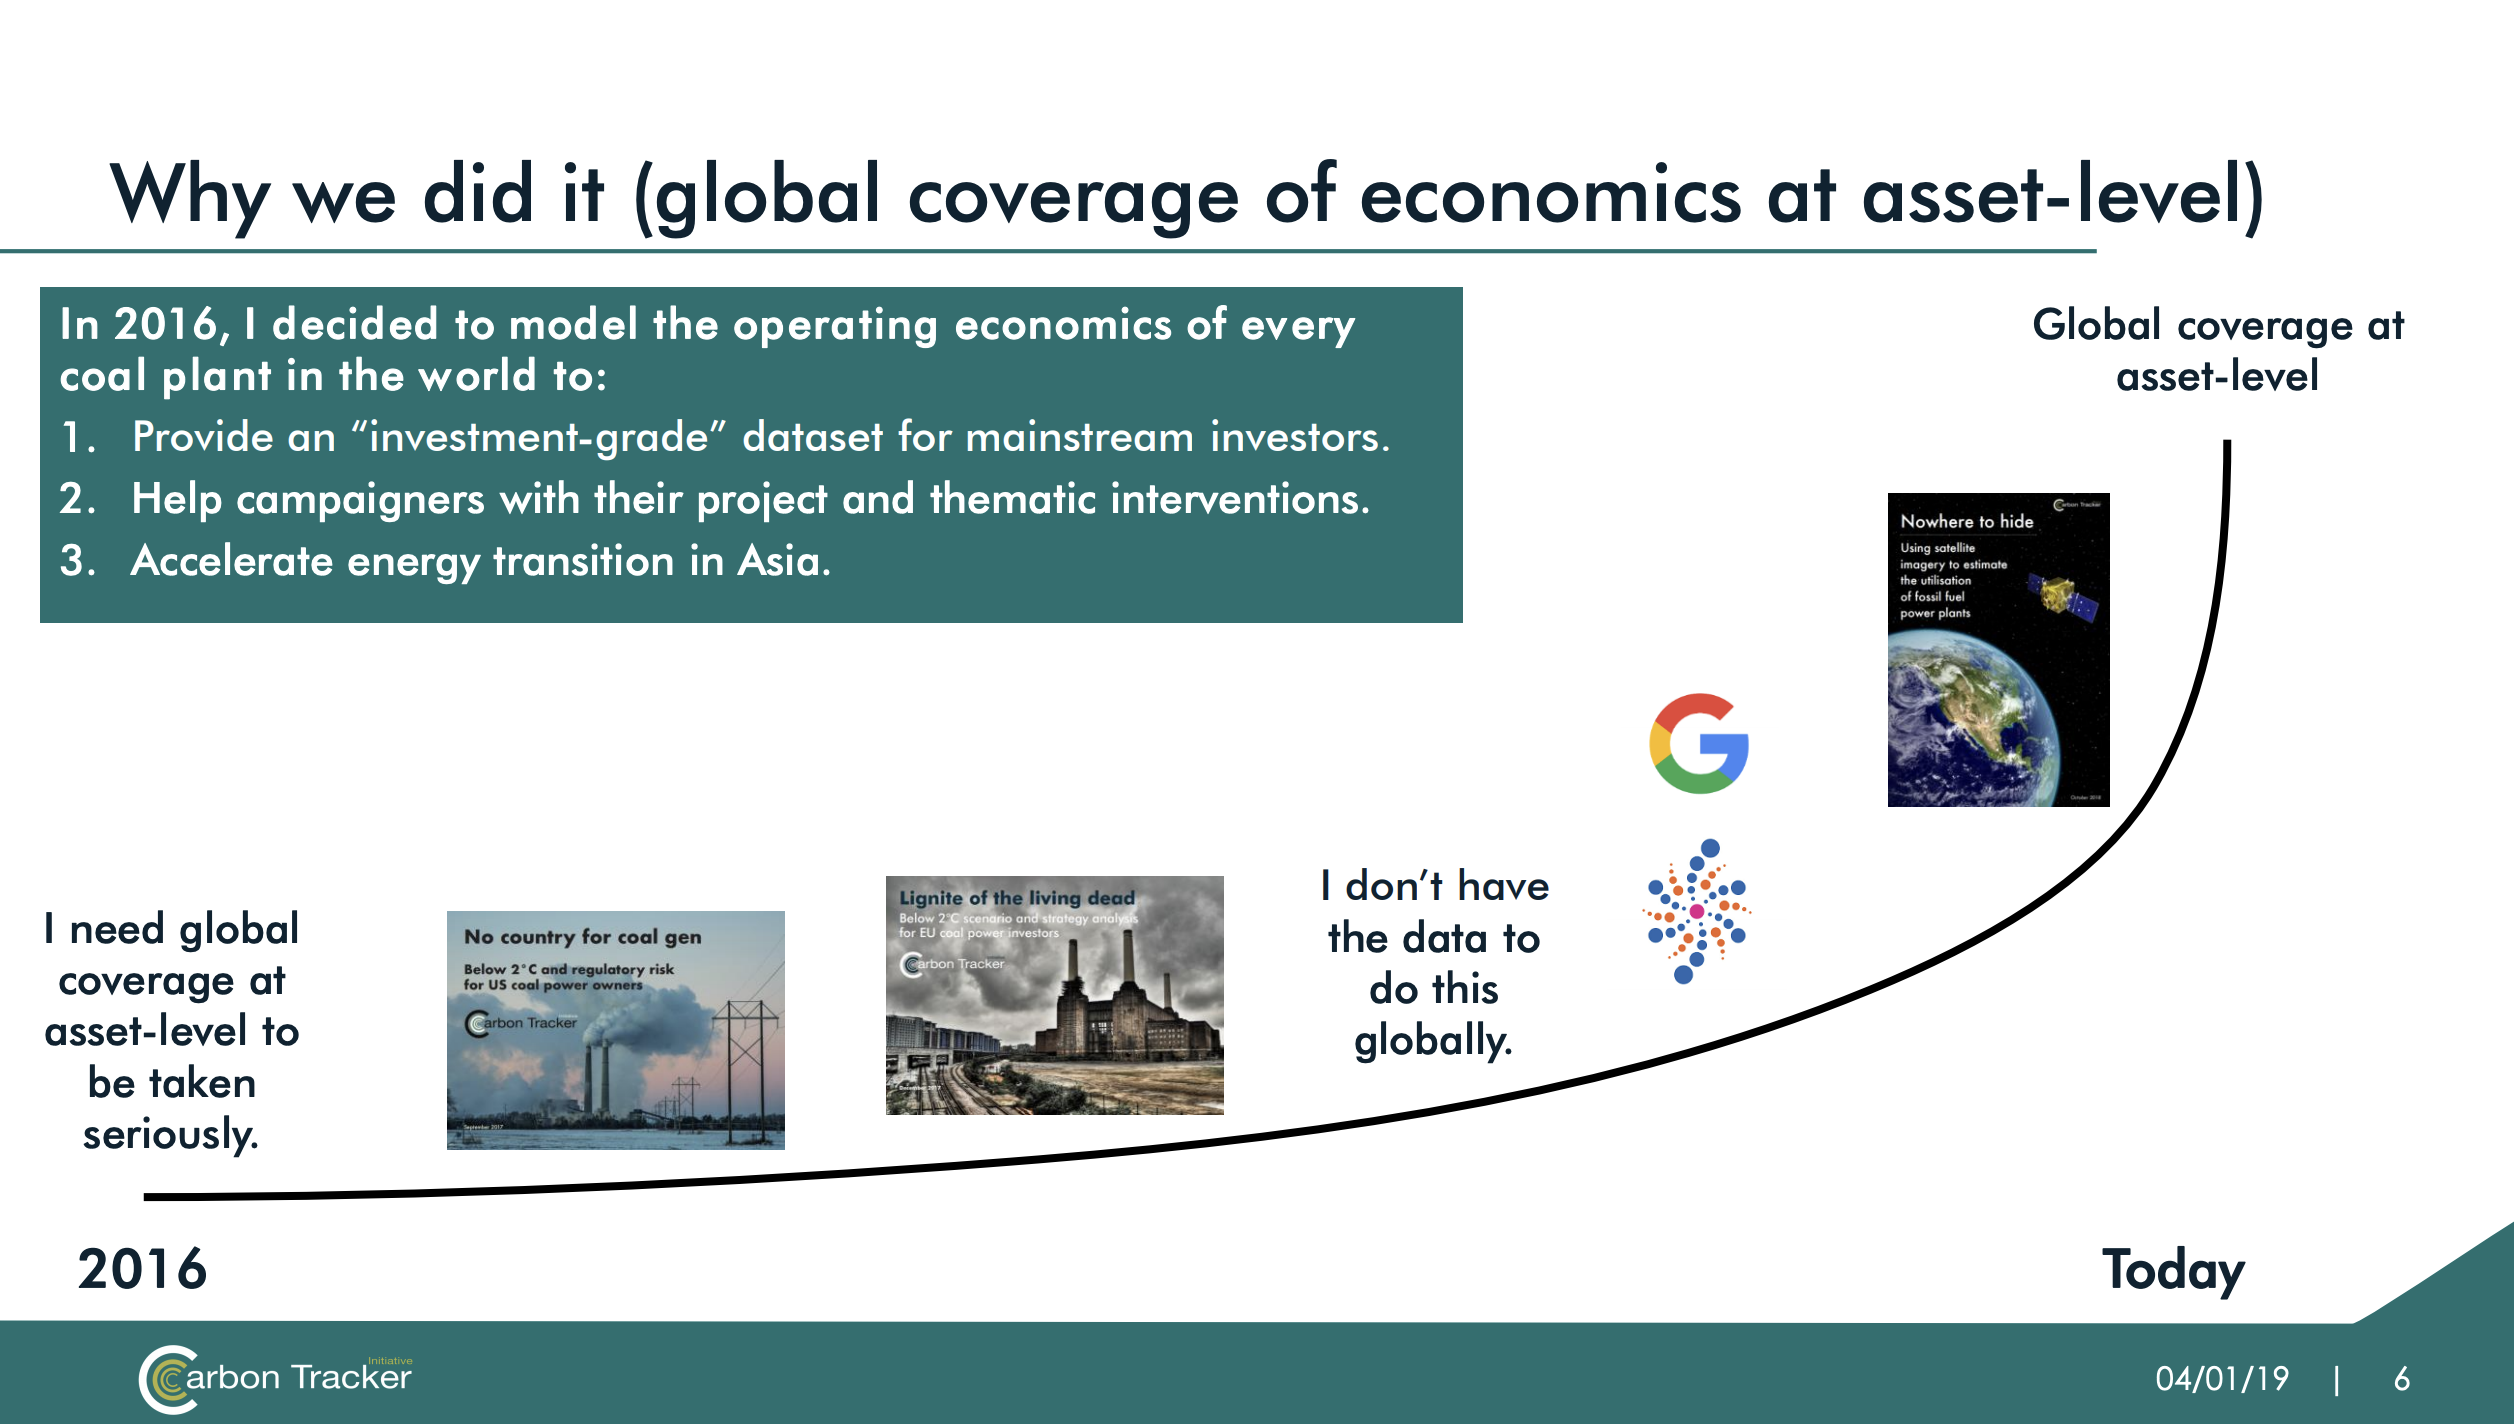
Matt Gray, Managing Director, Co-Head of Power & Utilities at Carbon Tracker, https://www.slideshare.net/MatthewGray16/bloomberg-satellite-and-climate-convening
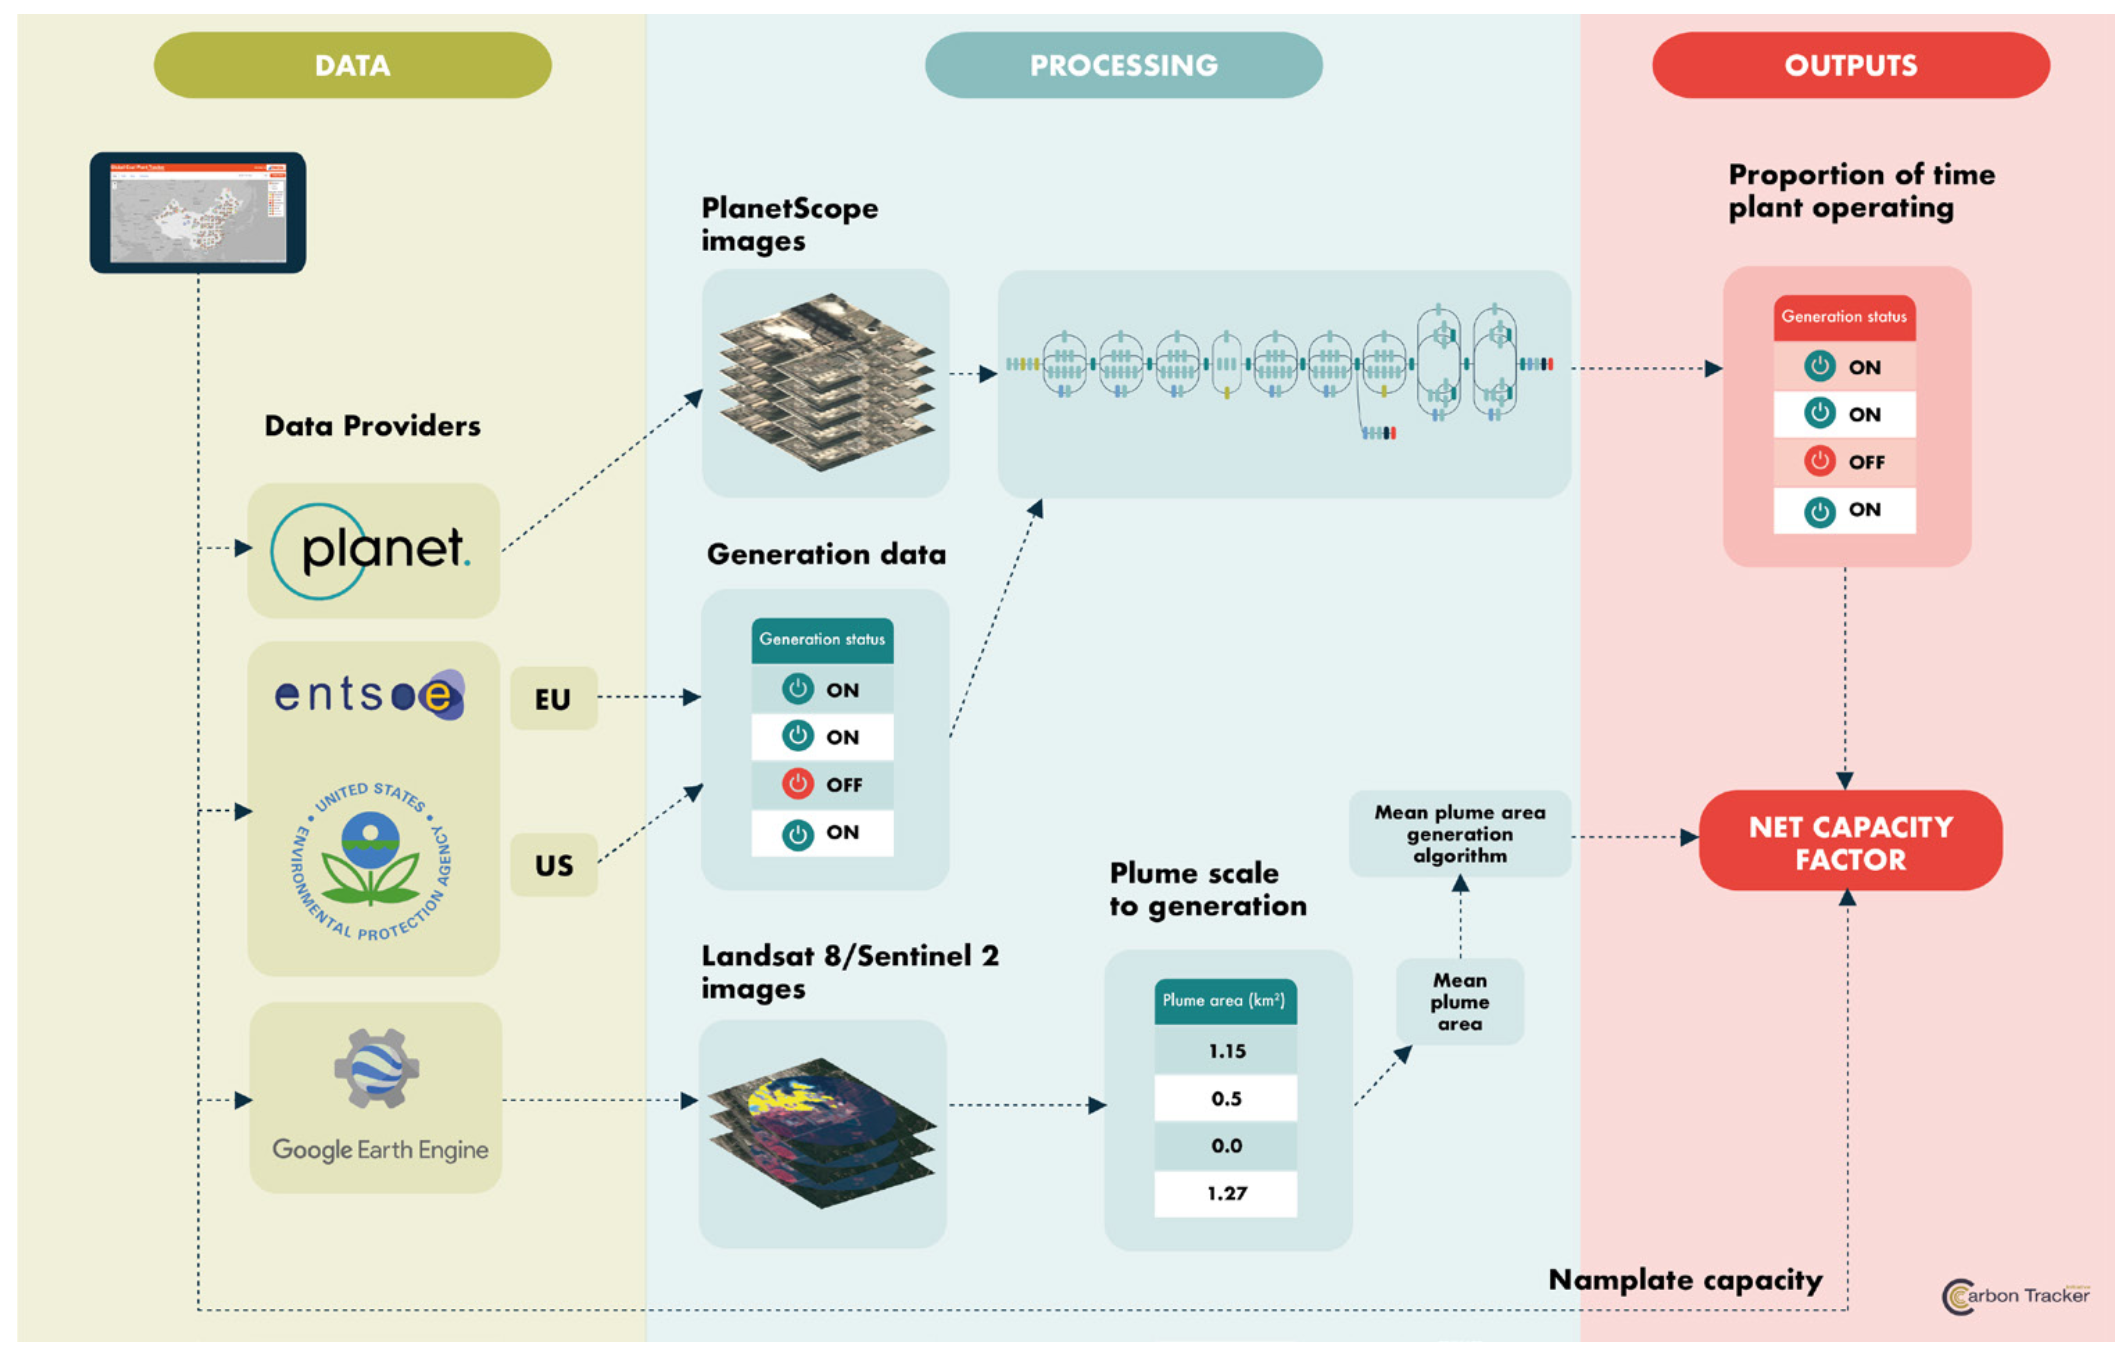
Carbon Tracker, https://carbontracker.org/reports/nowhere-to-hide/
Outcomes
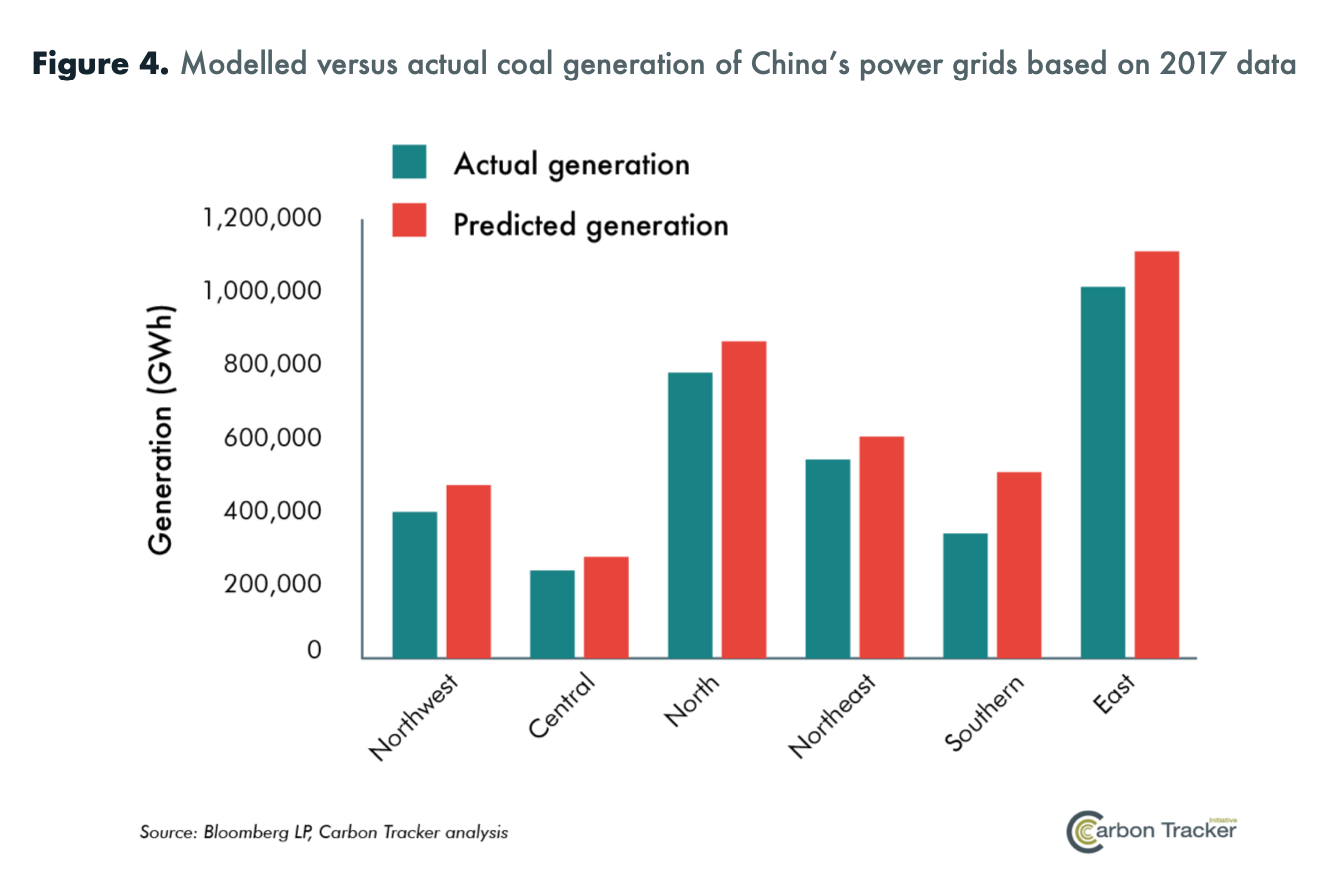
Carbon Tracker, https://carbontracker.org/reports/nowhere-to-hide/
Why do UK solar panels need locating?
Better forecasting

In the UK, better PV forecasts should save £1-10 million per year [1], and about 100,000 tonnes of CO2 per year.
Don't we know where the PV is already?
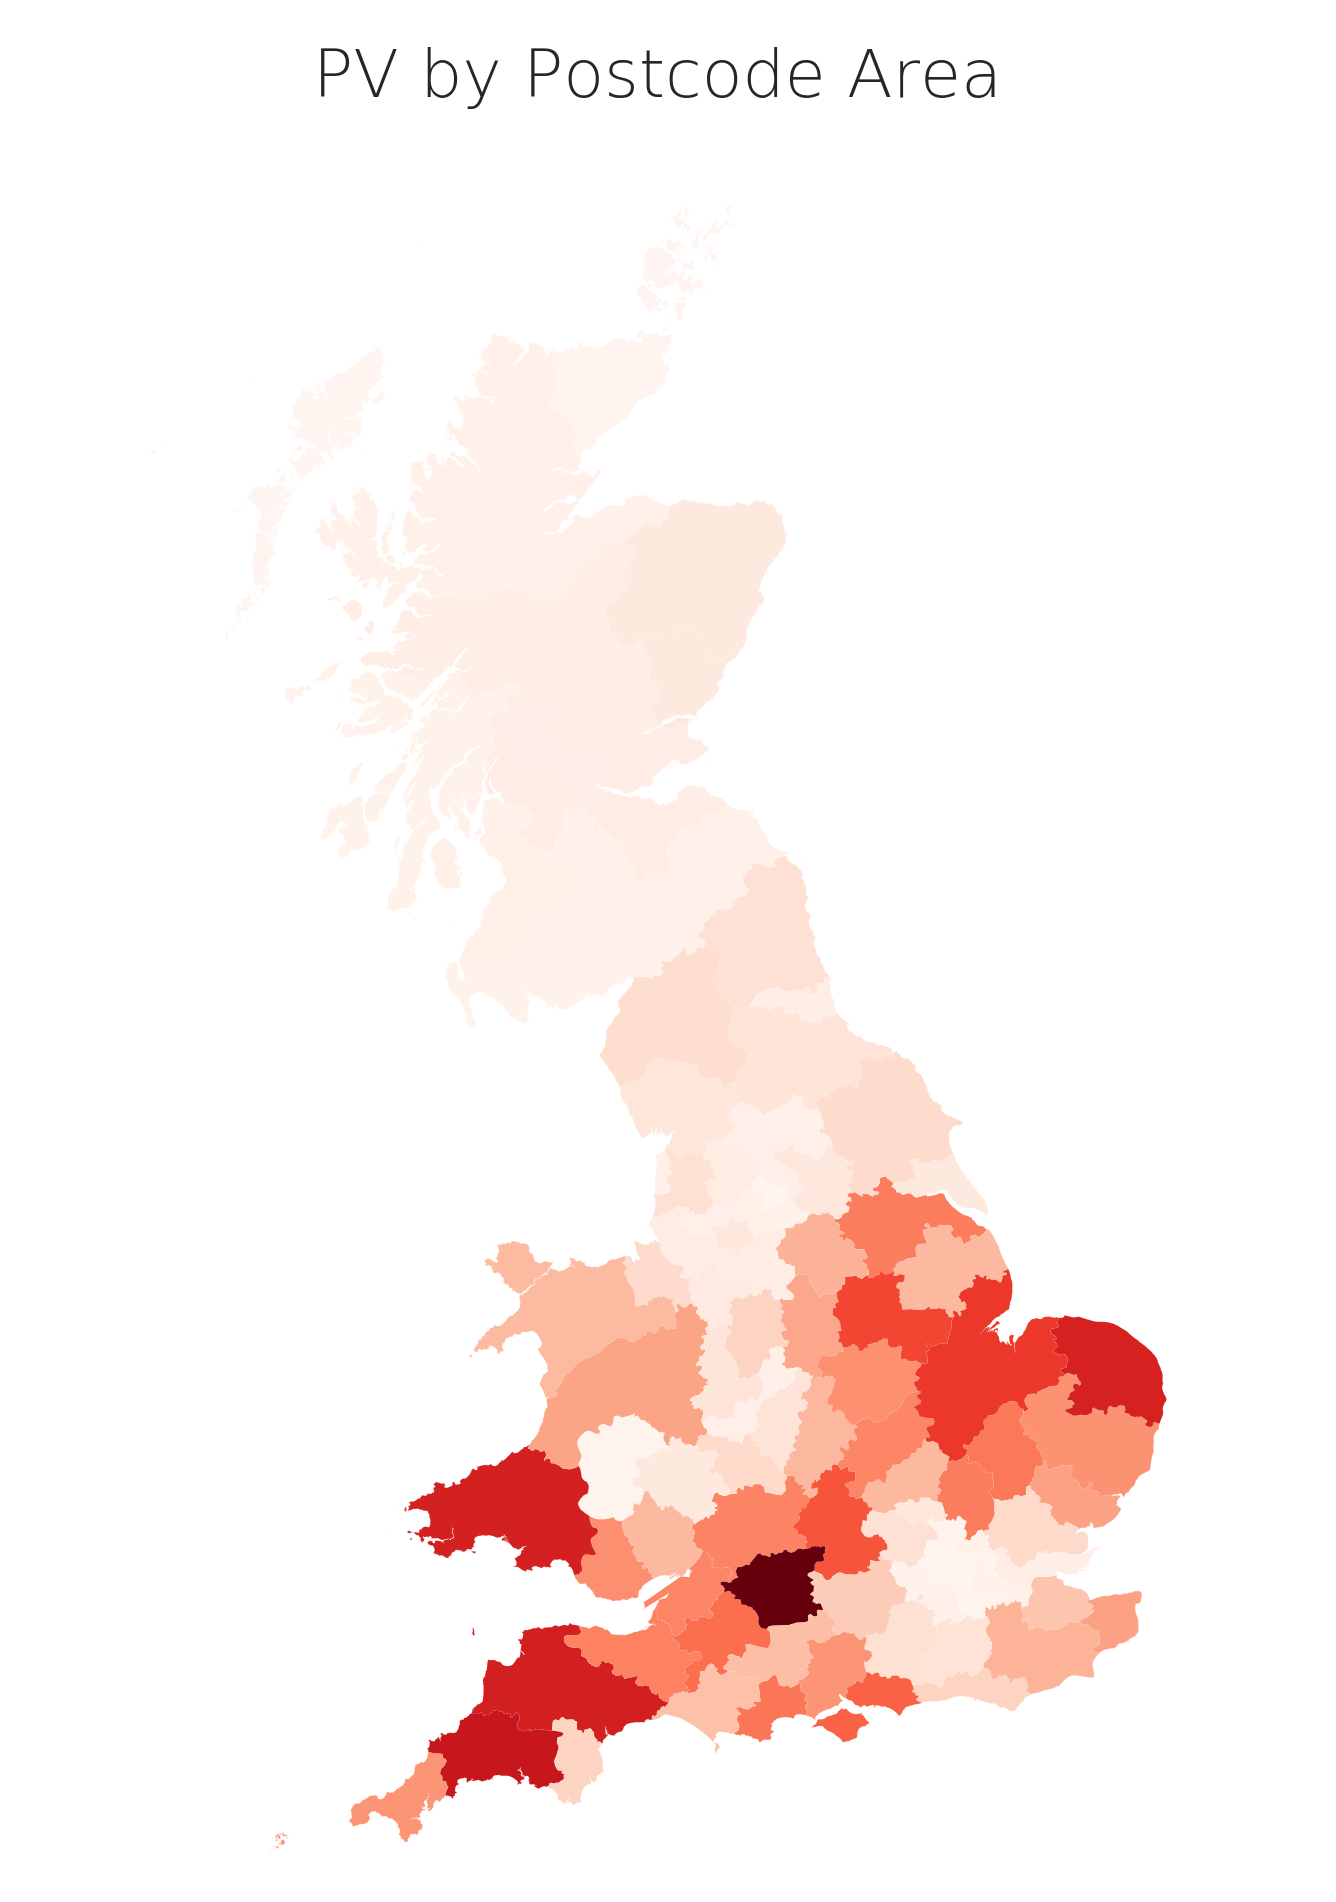
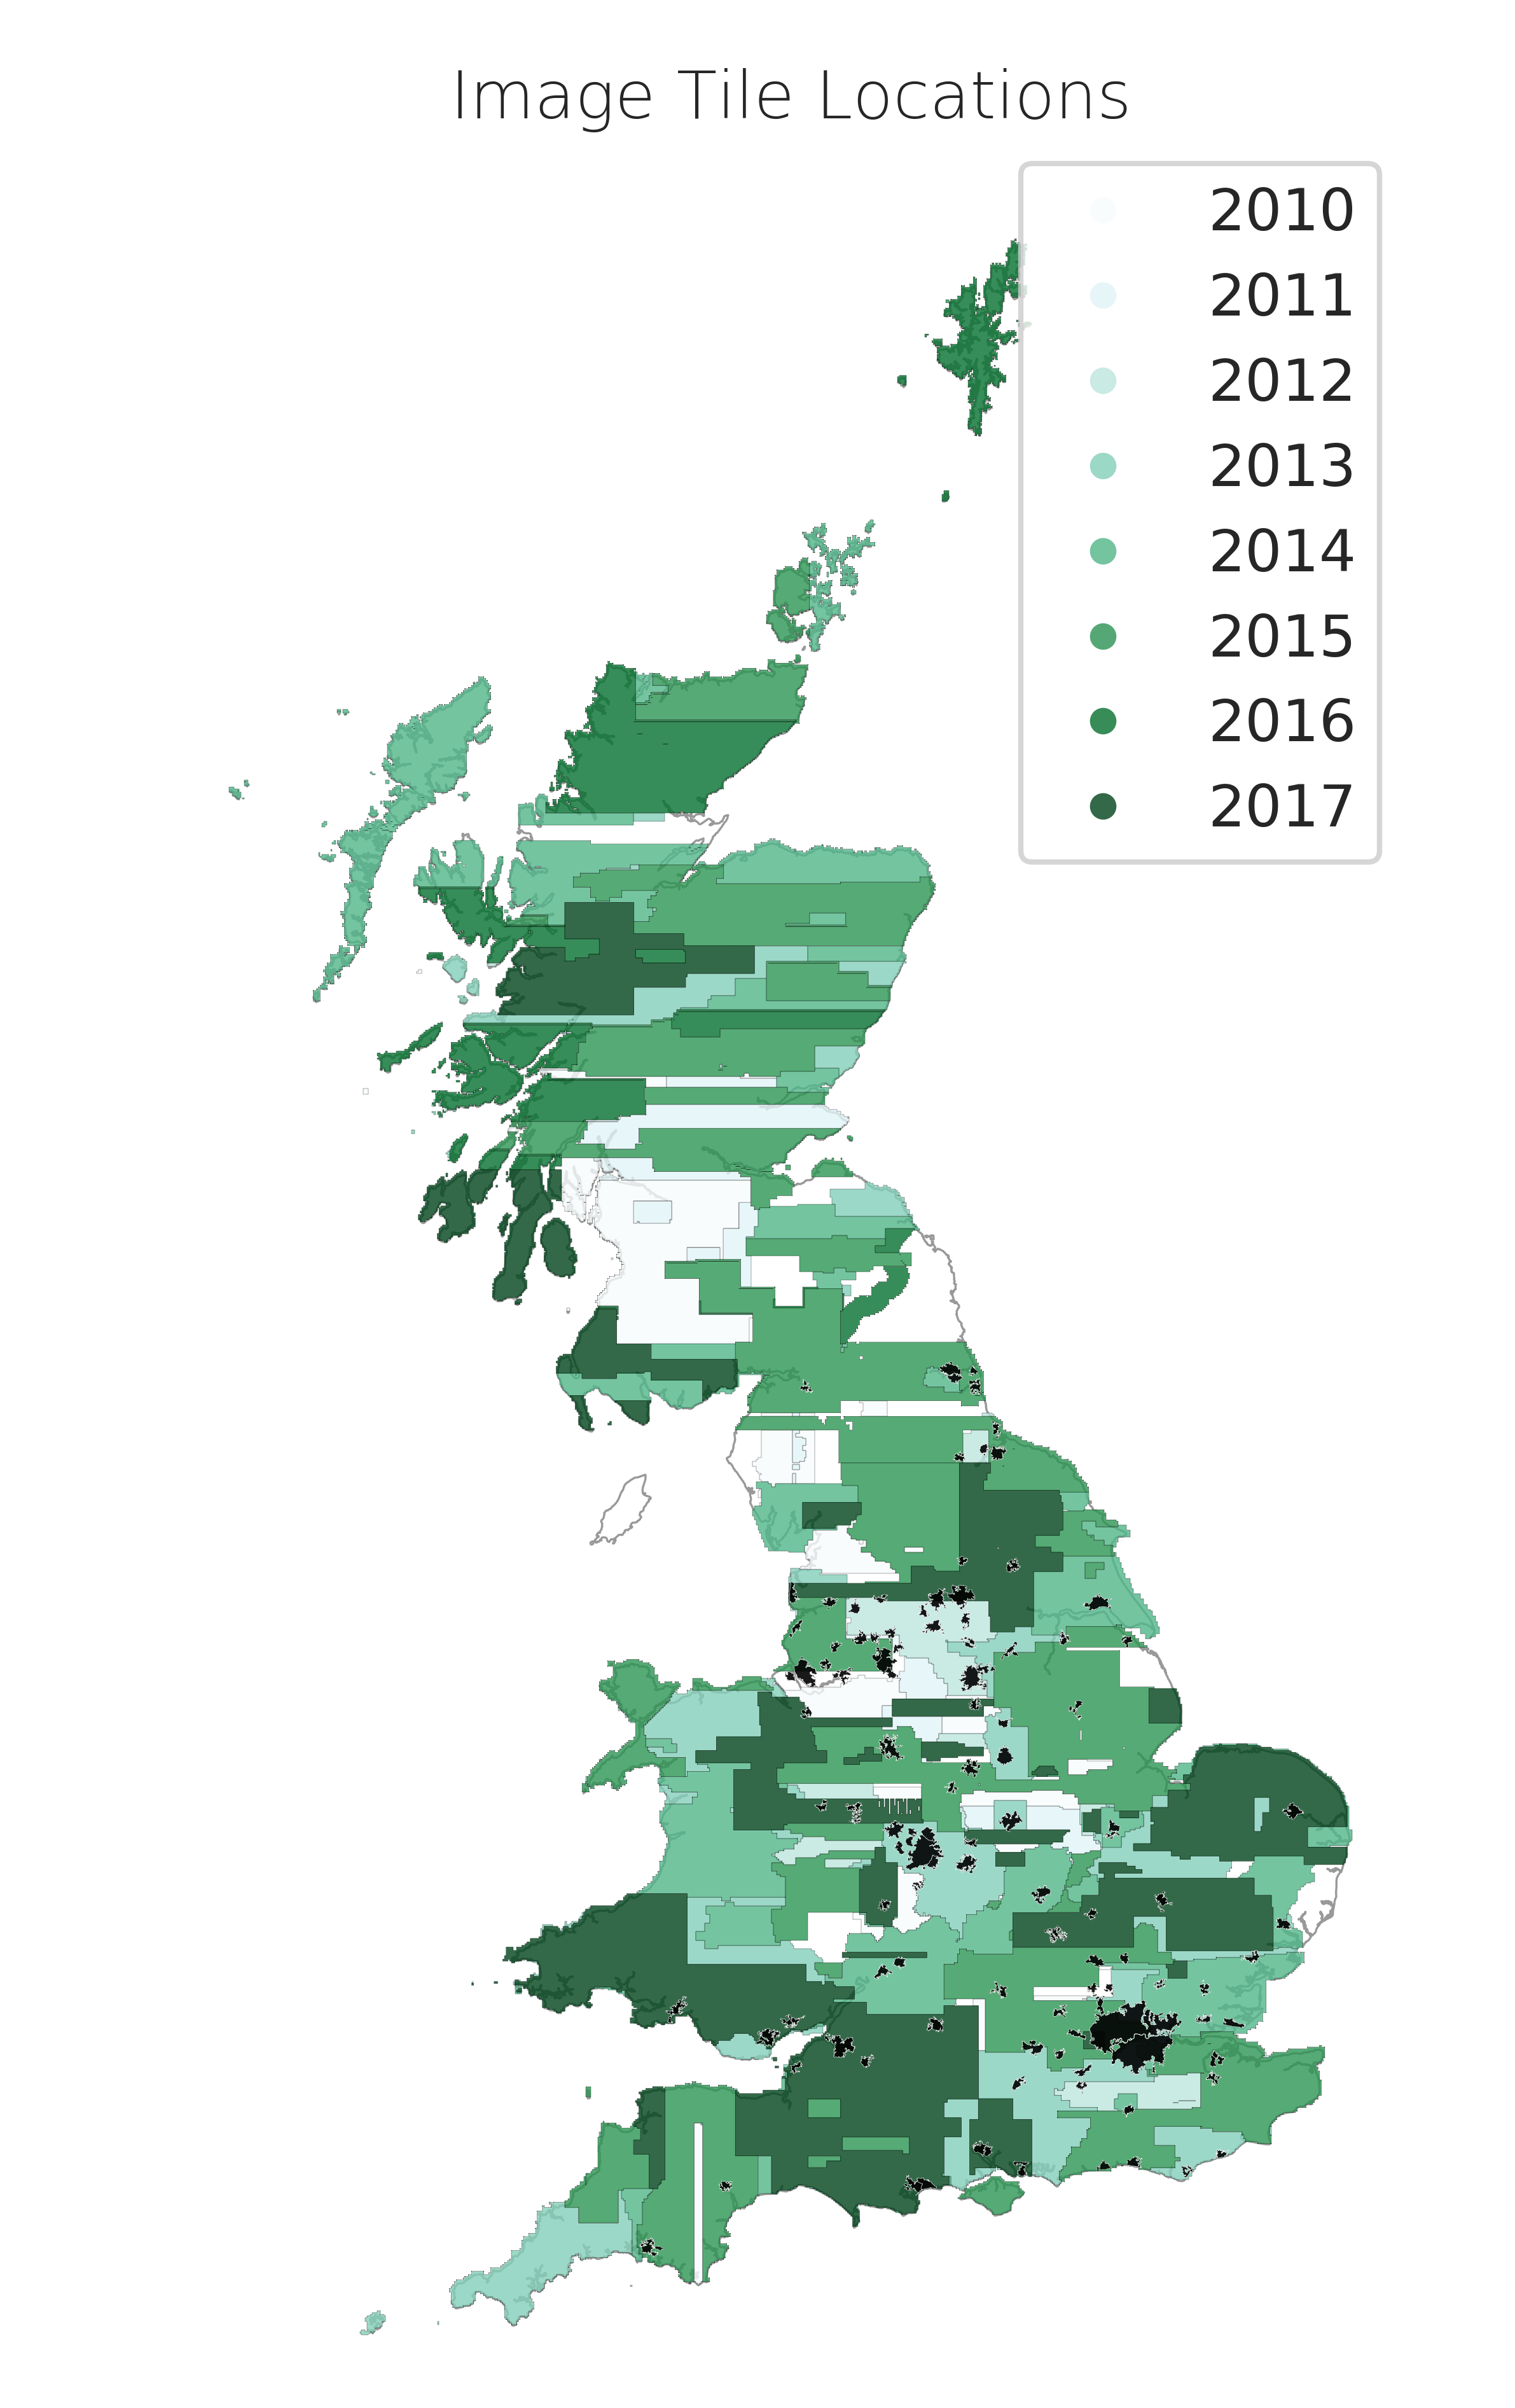
UK PV over time
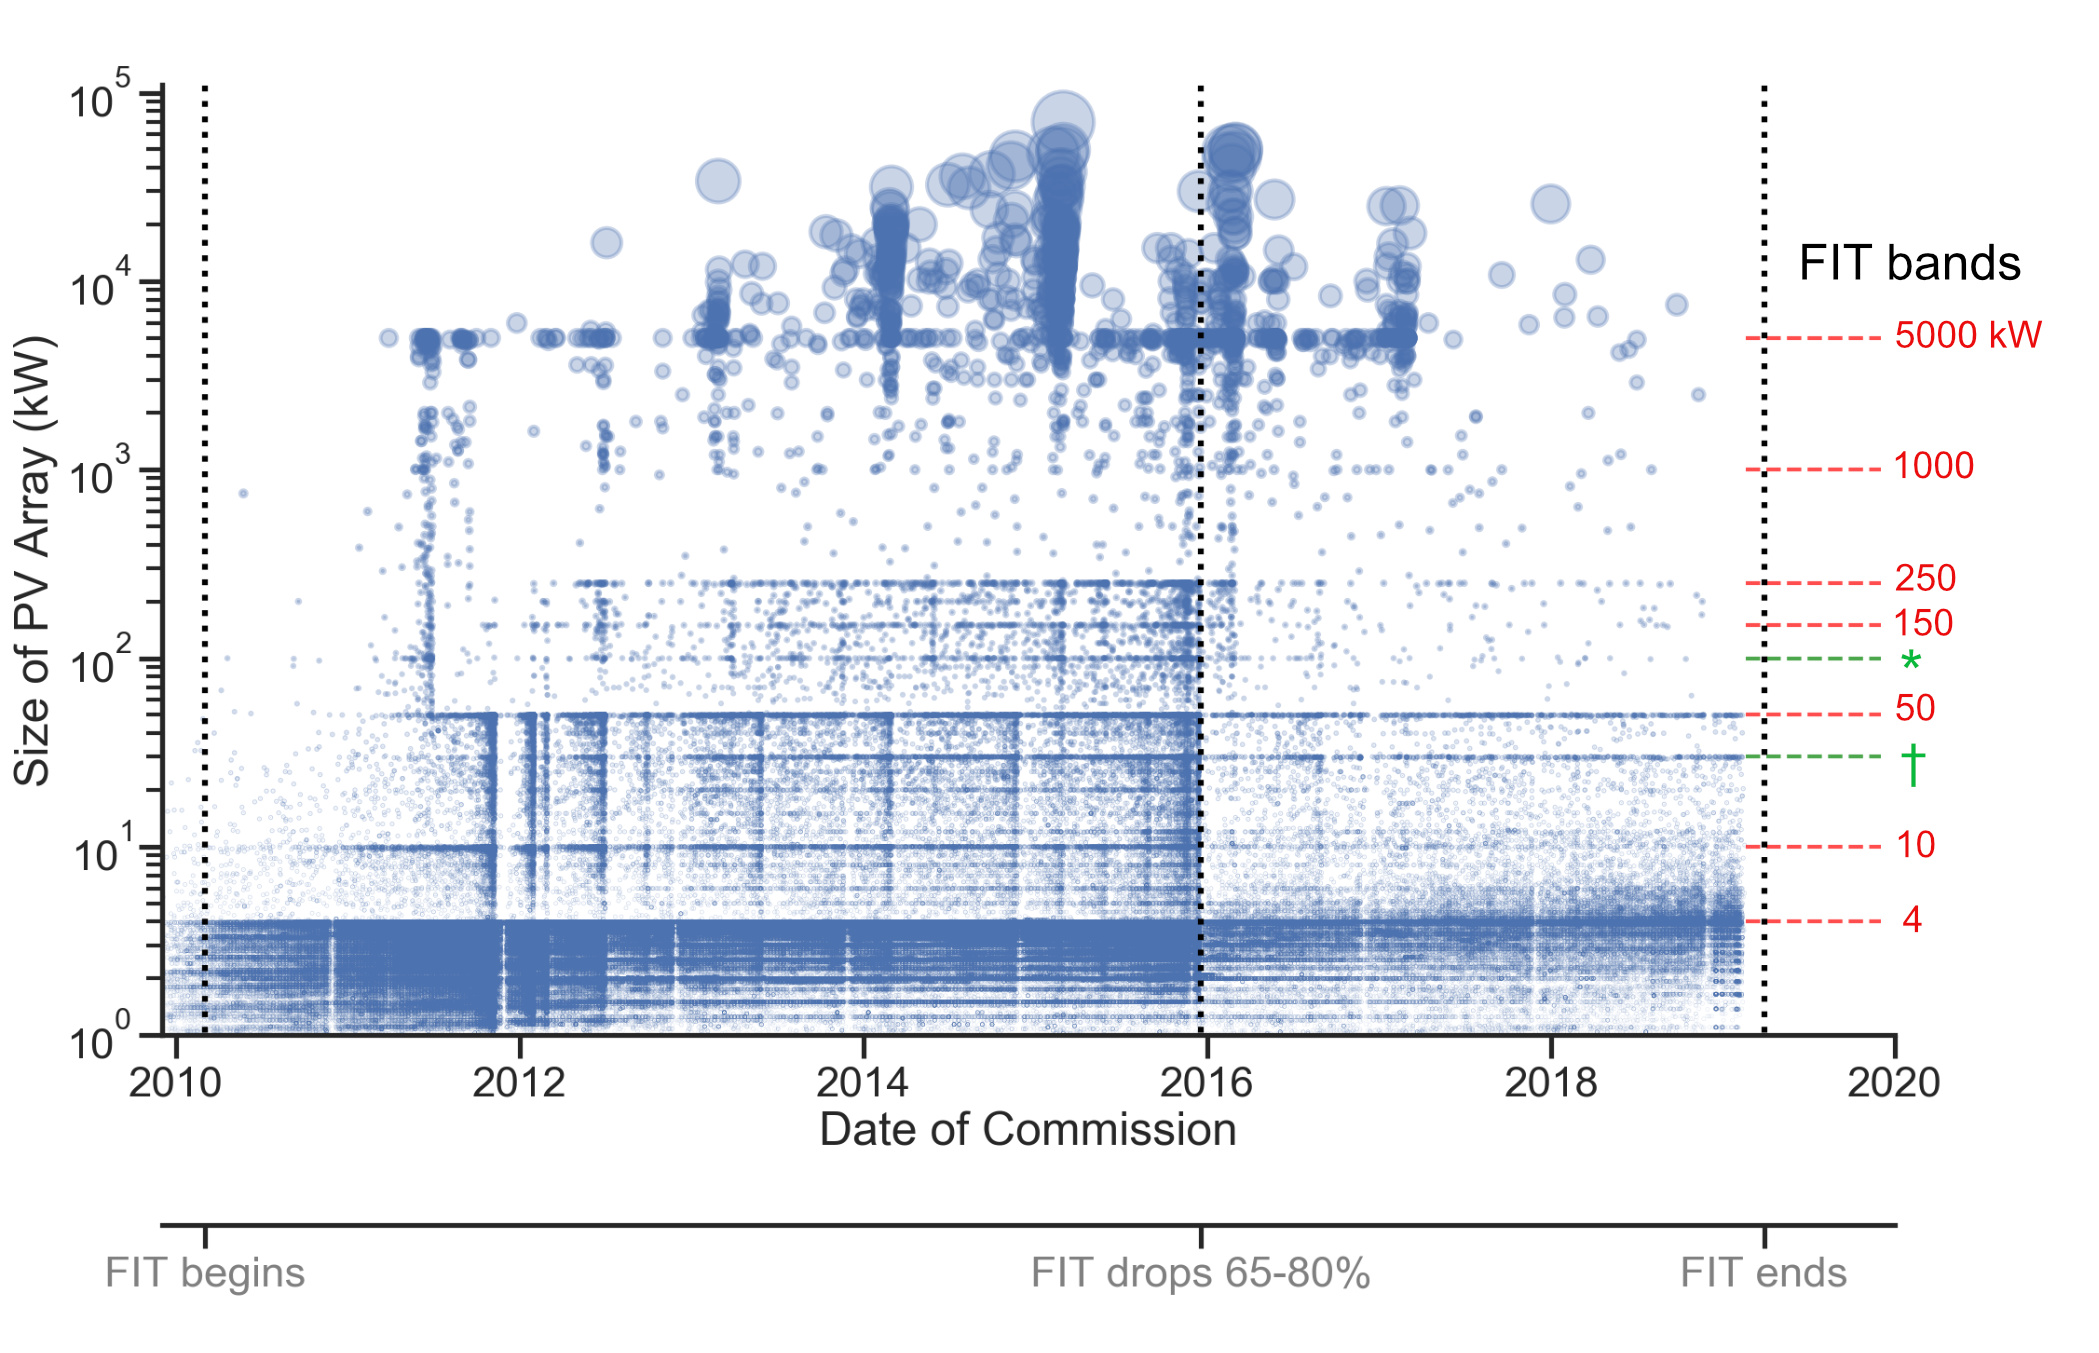
Nowcasting
Source: Open Climate Fix
My plan to
locate solar PV
- Get image data set of the UK
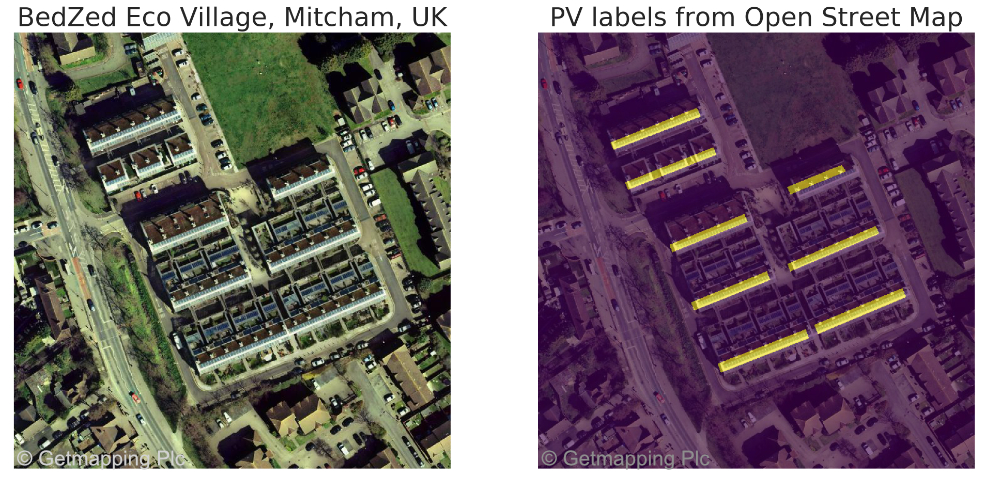
- Use Open Street Map labels for solar panels to create a training set
- Use neural networks for semantic segmentation on all images to find the rest of the panels
- Write up and relax
Semantic segmentation?

Image source: CSAIL
Workflow
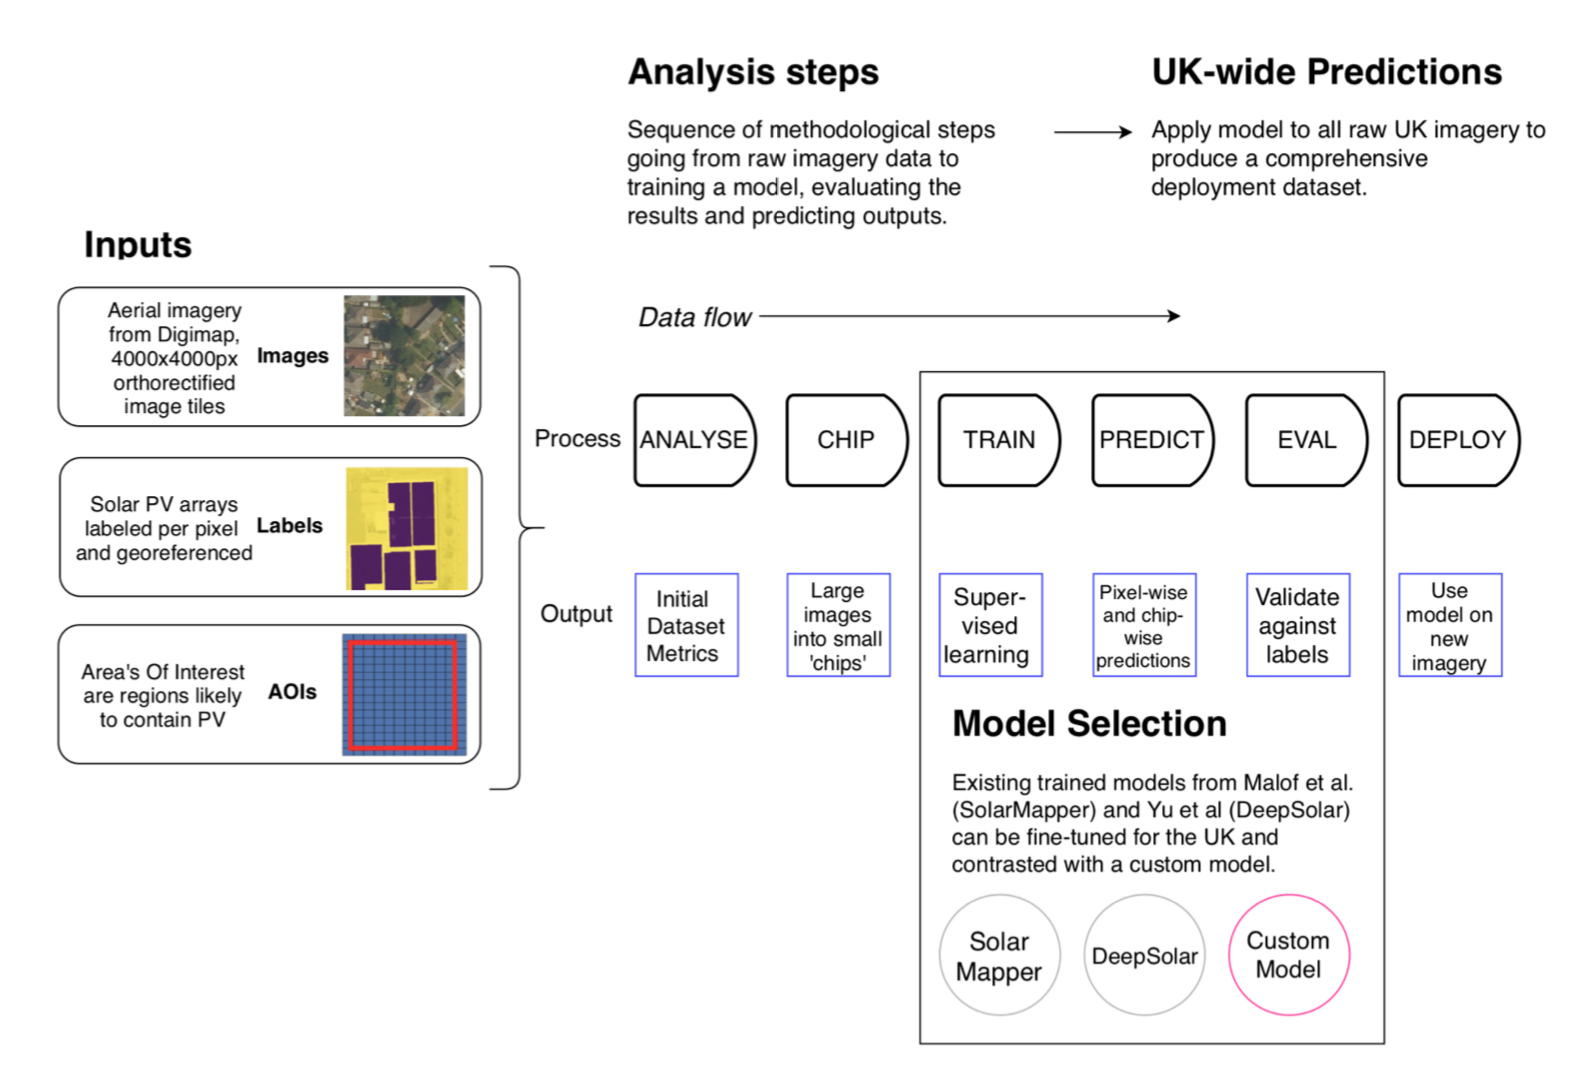
What data can we use?
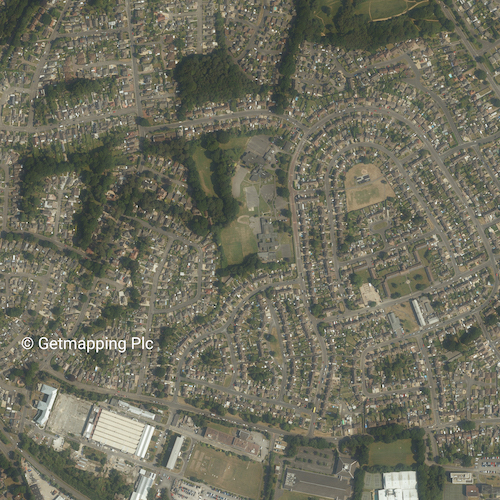
Academic license - use Digimap
Aerial Digimap product, licensed from Getmapping plc.
25cm vertical ortho-photography
2TB of imagery data...
Beautiful!
Image age
Ok, but what about the labels?
Enter Open Street Map!
At the time, 15000 labels
Now... 240,000+ !
          # # https://wiki.openstreetmap.org/wiki/Overpass_API/Overpass_API_by_Example

          solar_query = """
          [out:json];
          area["name"="United Kingdom"]->.searchArea;
          (
          nwr(area.searchArea)["generator:source"="solar"]['generator:output:electricity'='yes'];
          );
          out body;
          >;
          out skel qt;
          """
        overpass_url = "http://overpass-api.de/api/interpreter"

        import requests
        osm_pv = requests.get(overpass_url, params={'data': solar_query})
        df = pd.DataFrame(osm_pv.json()['elements'])
Setting up a pipeline?
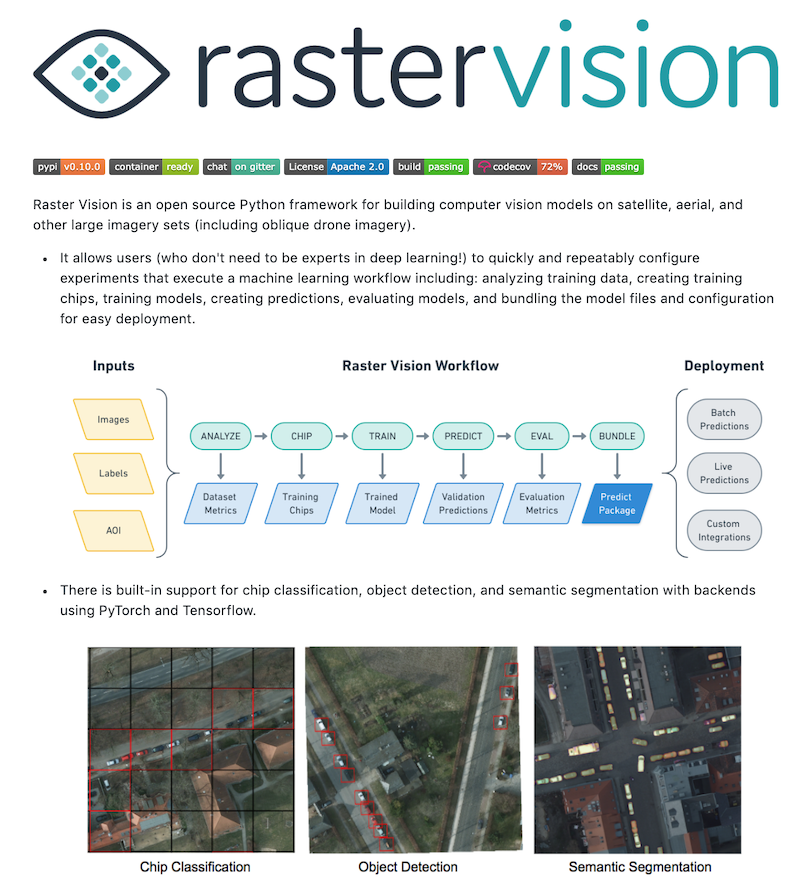
Enter RasterVision
An open source framework for deep learning on satellite and aerial imagery.
Thank you Azavea 👏
How to use RasterVision
See my experiment script here: https://github.com/Rabscuttler/raster-vision/tree/master/code
Setup
- Docker image
- nvidia-docker requires Linux for GPUs
- Dependencies are a pain to manage otherwise
- GPUs mandatory - model runs can easily take 12hrs+ depending on experiment
Experiments
RasterVision takes on a lot of the work that would be reasonably boilerplate between geospatial analysis projects.
            import rastervision as rv

            ##########################################
            # Experiment
            ##########################################

            class SolarExperimentSet(rv.ExperimentSet):
            def exp_main(self, test=False):

              # experiment goes here
Experiment Steps
- SETUP
- TASK
- BACKEND
- DATASET (TRAINING & VALIDATION)
- ANALYZE
- EXPERIMENT
Setup
                  # Connect docker filepath mounted to my data directory
                  base_uri = join(raw_uri, '/labels')

                  # Experiment label, used to label config files
                  exp_id = 'pv-detection-1'

                  # Number of times passing a batch of images through the model
                  num_steps = 1e5
                  batch_size = 8
                  # Specify whether or not to make debug chips (a zipped sample of png chips
                  # that you can examine to help debug the chipping process)
                  debug = True

                  # Split the data into training and validation sets:
                  # Randomize the order of all scene ids
                  random.seed(5678)
                  scene_ids = sorted(scene_ids)
                  random.shuffle(scene_ids)

                  # Figure out how many scenes make up 80% of the whole set
                  num_train_ids = round(len(scene_ids) * 0.8)
                  # Split the scene ids into training and validation lists
                  train_ids = scene_ids[0:num_train_ids]
                  val_ids = scene_ids[num_train_ids:]
Task
              # ------------- TASK -------------

              task = rv.TaskConfig.builder(rv.SEMANTIC_SEGMENTATION) \
                .with_chip_size(300) \
                .with_classes({
                'pv': (1, 'yellow'),
                'background': (2, 'black')
              }) \
              .with_chip_options(
                chips_per_scene=50,
                debug_chip_probability=0.1,
                negative_survival_probability=1.0,
                target_classes=[1],
                target_count_threshold=1000) \
              .build()
Backend
            # # ------------- BACKEND -------------
            backend = rv.BackendConfig.builder(rv.TF_DEEPLAB) \
              .with_task(task) \
              .with_debug(debug) \
              .with_batch_size(num_steps) \
              .with_num_steps(batch_size) \
              .with_model_defaults(rv.MOBILENET_V2) \
              .build()

            # Make scenes to pass to the DataSetConfig builder.
            def make_scene(id):
              ###

            # Create lists of train and test scene configs
            train_scenes = [make_scene(id) for id in train_ids]
            val_scenes = [make_scene(id) for id in val_ids]
Dataset
            # ------------- DATASET -------------
            # Construct a DataSet config using the lists of train and
            # validation scenes
            dataset = rv.DatasetConfig.builder() \
              .with_train_scenes(train_scenes) \
              .with_validation_scenes(val_scenes) \
              .build()
Analyze
                # ------------- ANALYZE -------------
                # We will need to convert this imagery from uint16 to uint8
                # in order to use it. We specified that this conversion should take place
                # when we built the train raster source but that process will require
                # dataset-level statistics. To get these stats we need to create an
                # analyzer.
                analyzer = rv.AnalyzerConfig.builder(rv.STATS_ANALYZER) \
                  .build()
Experiment
          # ------------- EXPERIMENT -------------
          experiment = rv.ExperimentConfig.builder() \
            .with_id(exp_id) \
            .with_task(task) \
            .with_backend(backend) \
            .with_analyzer(analyzer) \
            .with_dataset(dataset) \
            .with_root_uri('/opt/data') \
            .build()

          return experiment


          if __name__ == '__name__':
            rv.main()
Run it!
Start up the docker container
          docker run --runtime=nvidia --rm -it -p 6006:6006 \
            -v ${RV_QUICKSTART_CODE_DIR}:/opt/src/code \
            -v ${RV_QUICKSTART_EXP_DIR}:/opt/data \
            quay.io/azavea/raster-vision:gpu-latest /bin/bash
Fire away
rastervision run local -p find_the_solar_pv.py
Method overview
- Image data from Aerial Digimap
- Training a model with 9,508 labels from Open Street Map
- Model is 'off-the-shelf' neural network
- Analysis pipeline, training and prediction with RasterVision
That would be too easy.
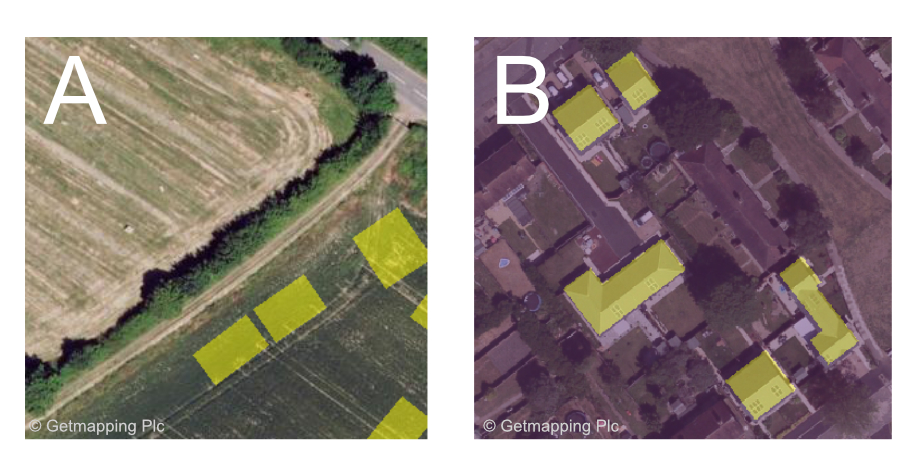
Creating a good training dataset is hard
Take two: train on an existing dataset
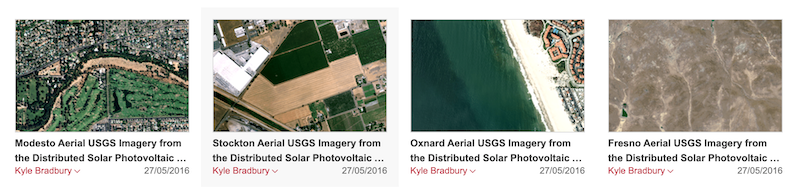
Bradbury, Kyle; Saboo, Raghav; Johnson, Timothy; Malof, Jordan; Devarajan, Arjun; Zhang, Wuming; et al. (2016): Full Collection: Distributed Solar Photovoltaic Array Location and Extent Data Set for Remote Sensing Object Identification. figshare. Collection. https://doi.org/10.6084/m9.figshare.c.3255643.v3
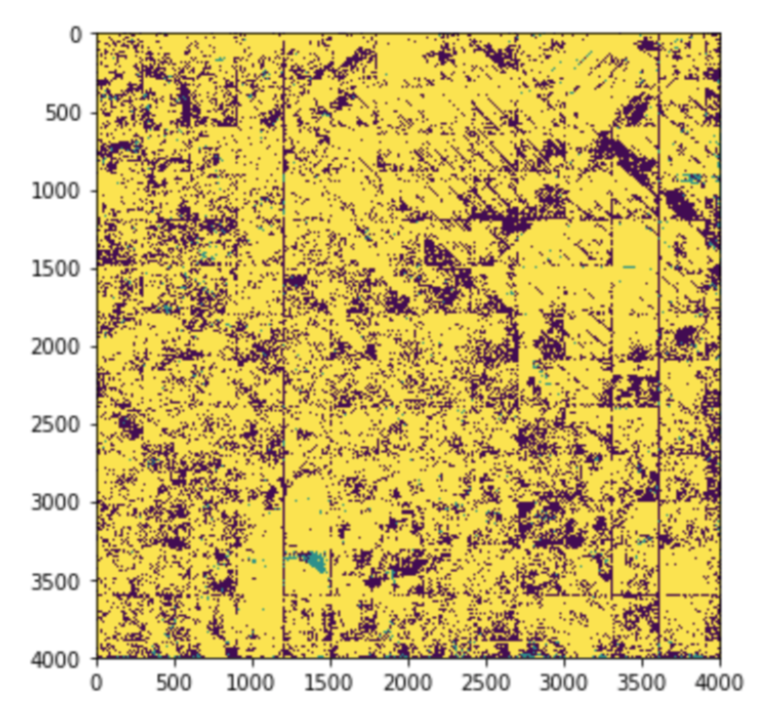
Predict on UK
Predict on UK
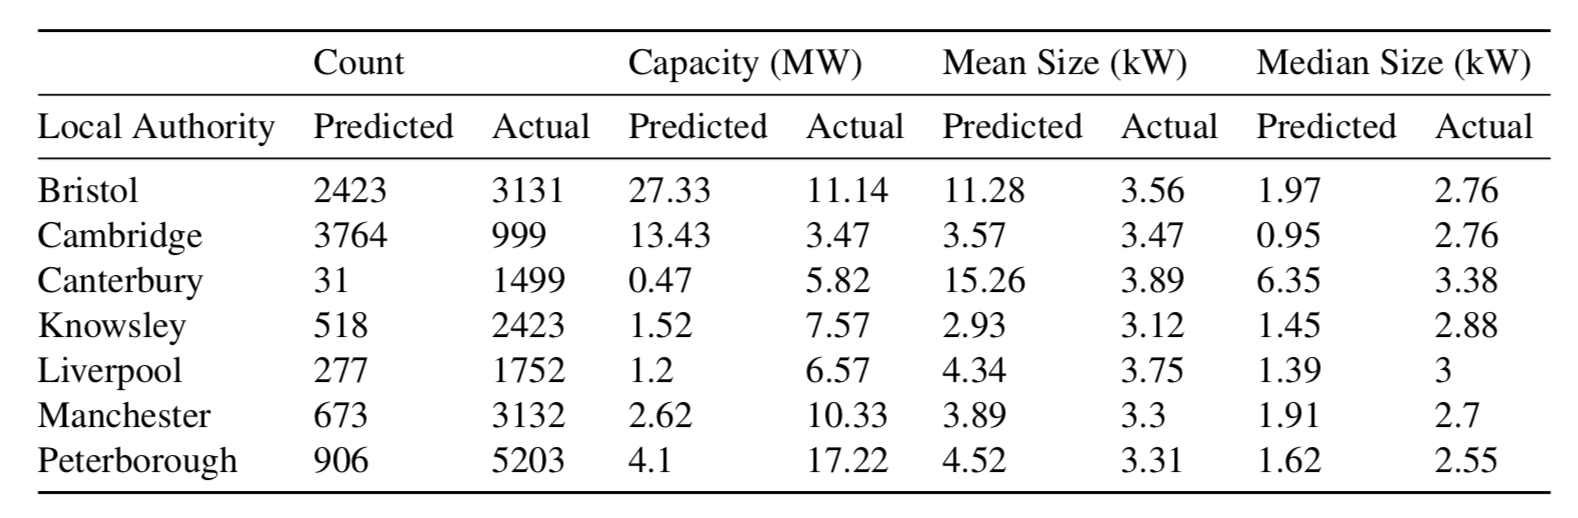
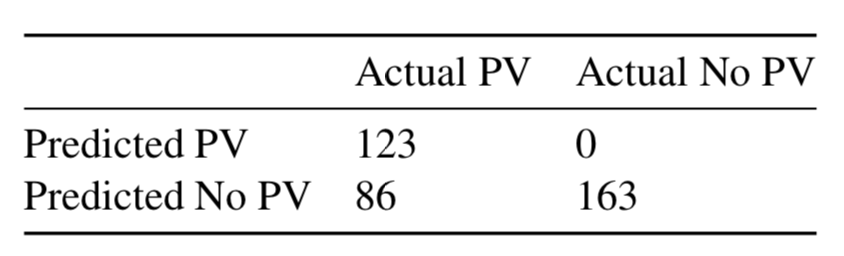
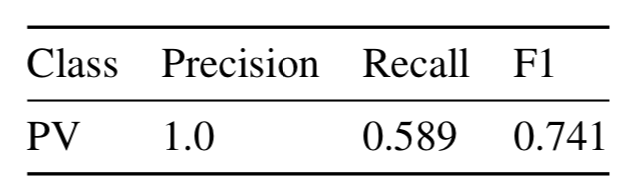
Results on a hand-selected UK set
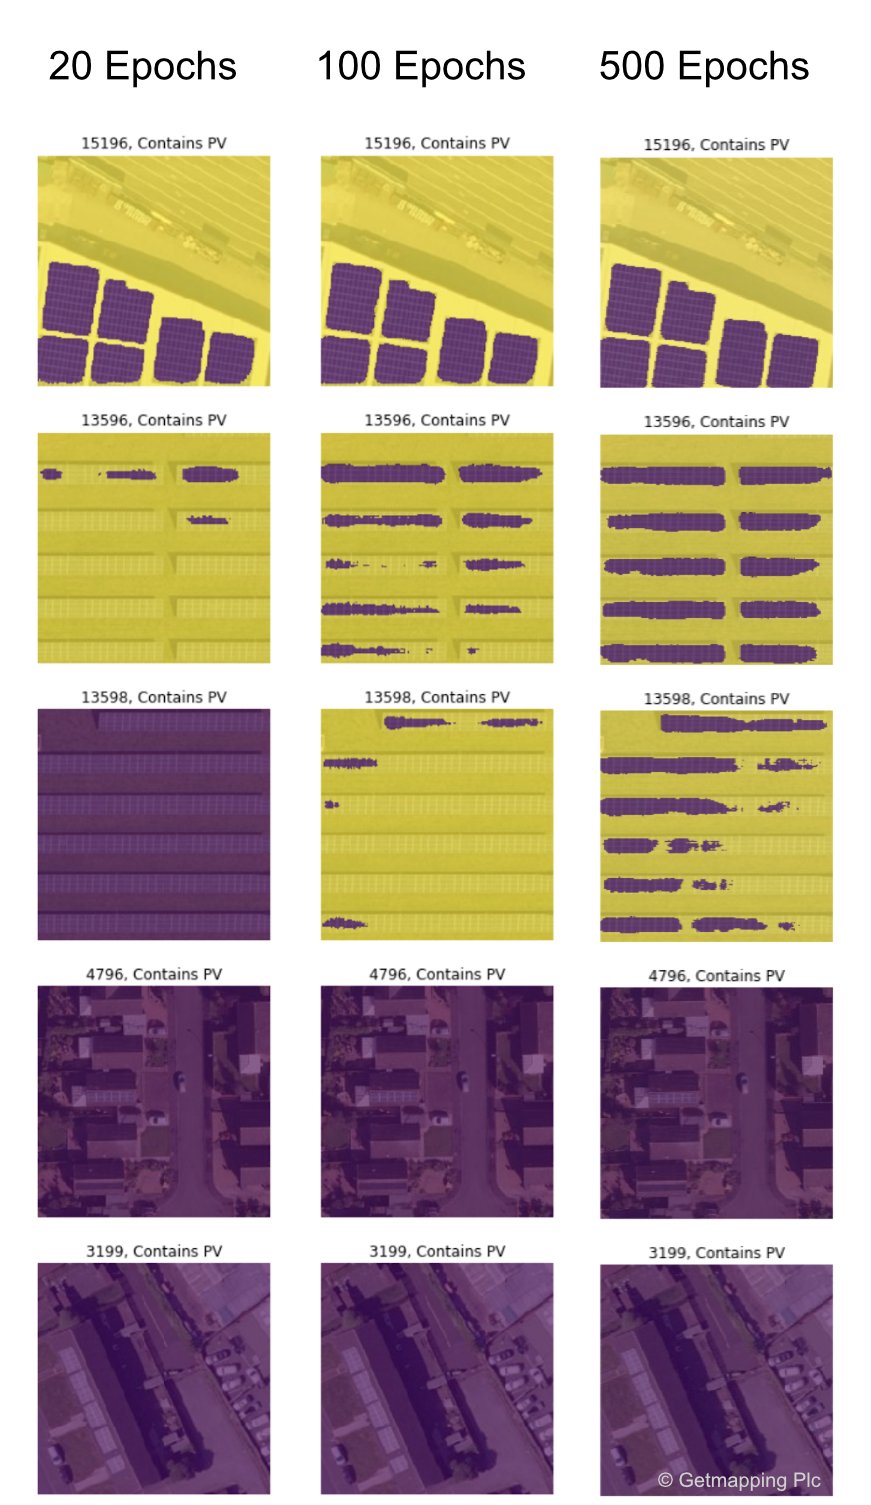
That's nice, I want pictures
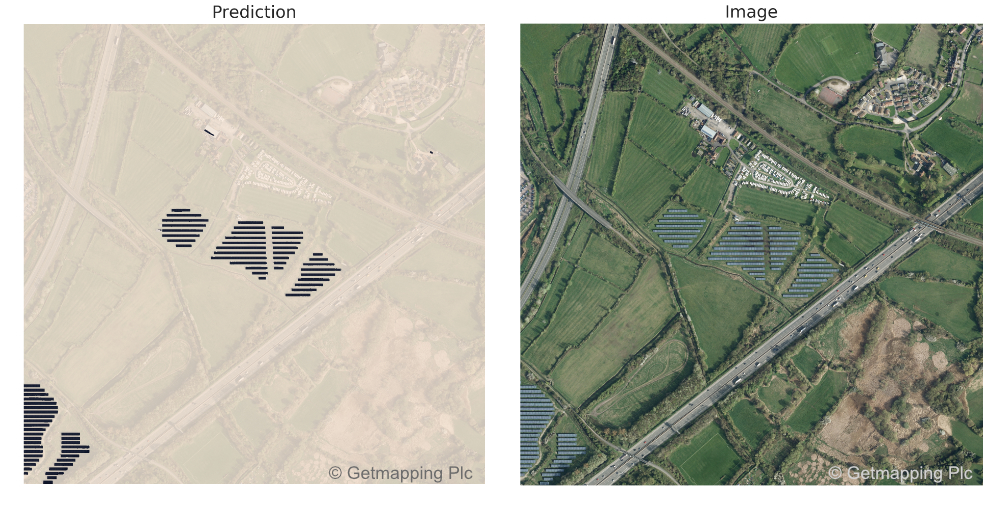
Urban predictions
Cambridge - lots of accurate predictions here.
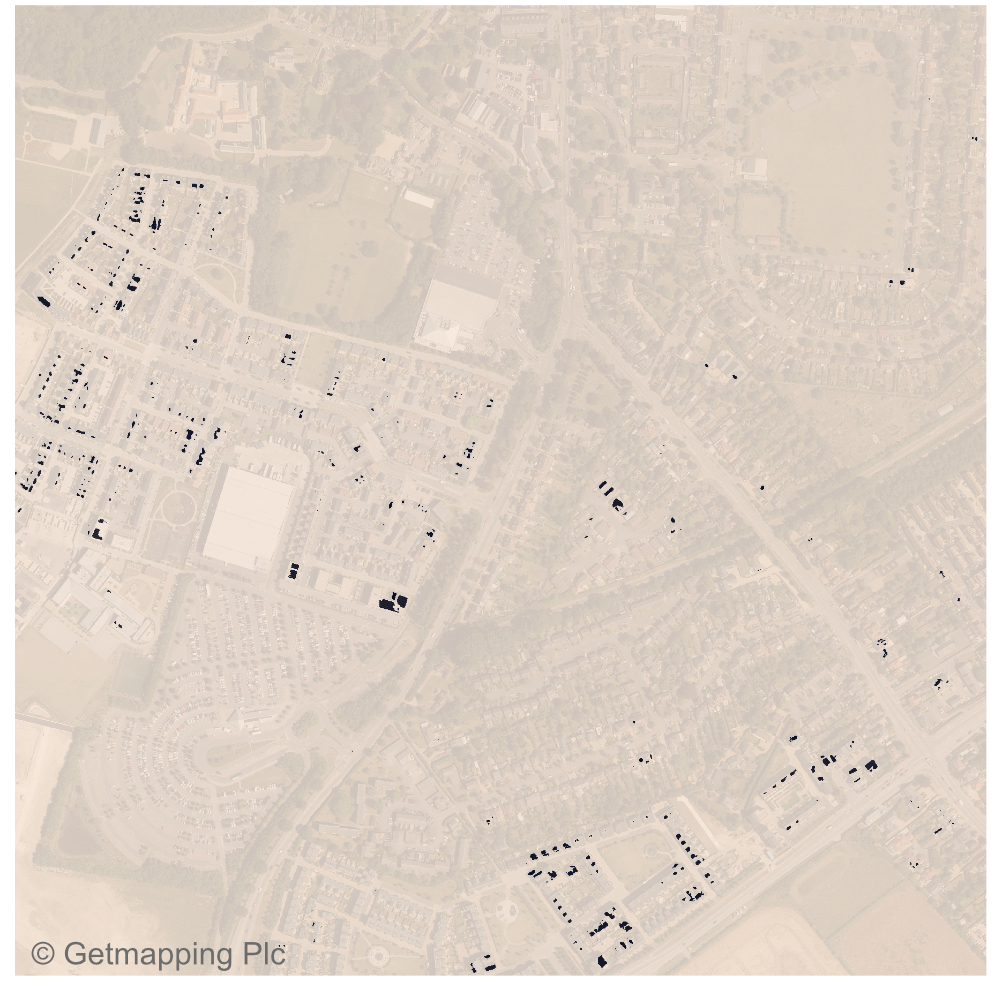
Detail
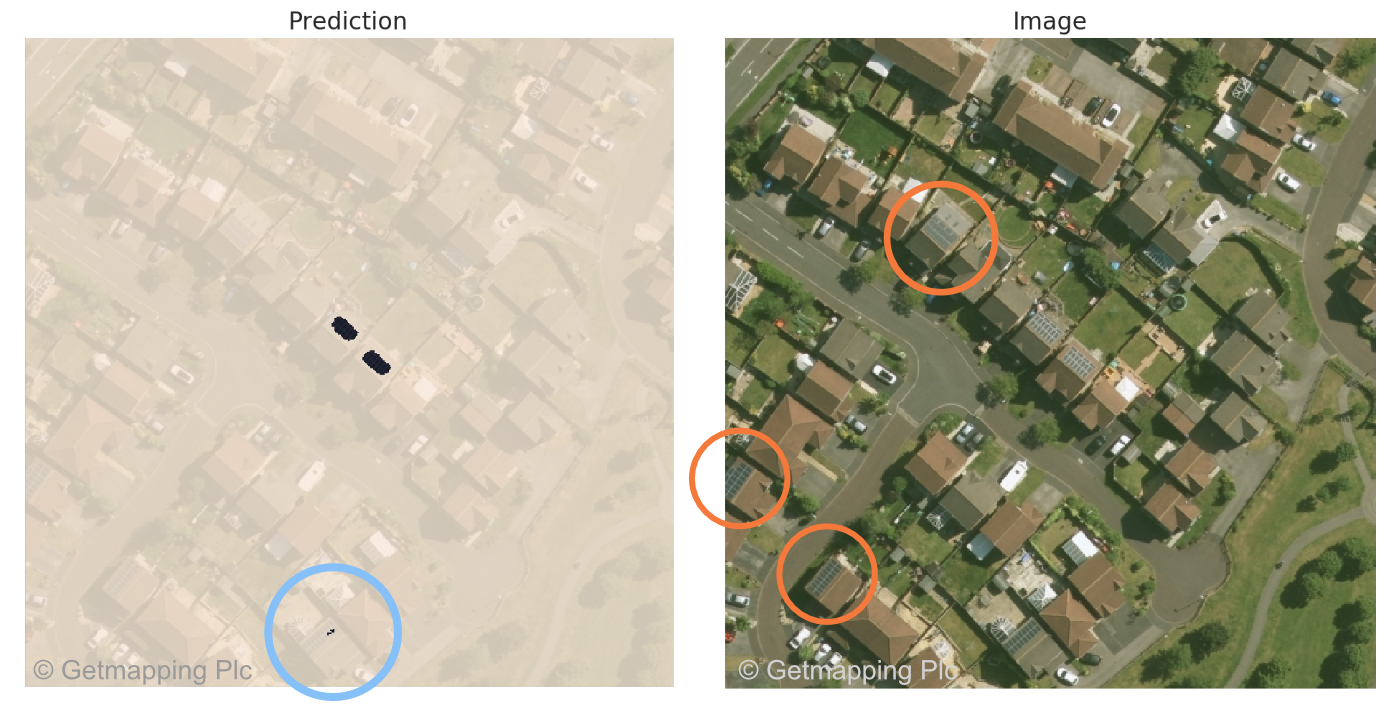
Knowsley - some hit some miss But - some things like conservatories have not come up as false positives.
False positives
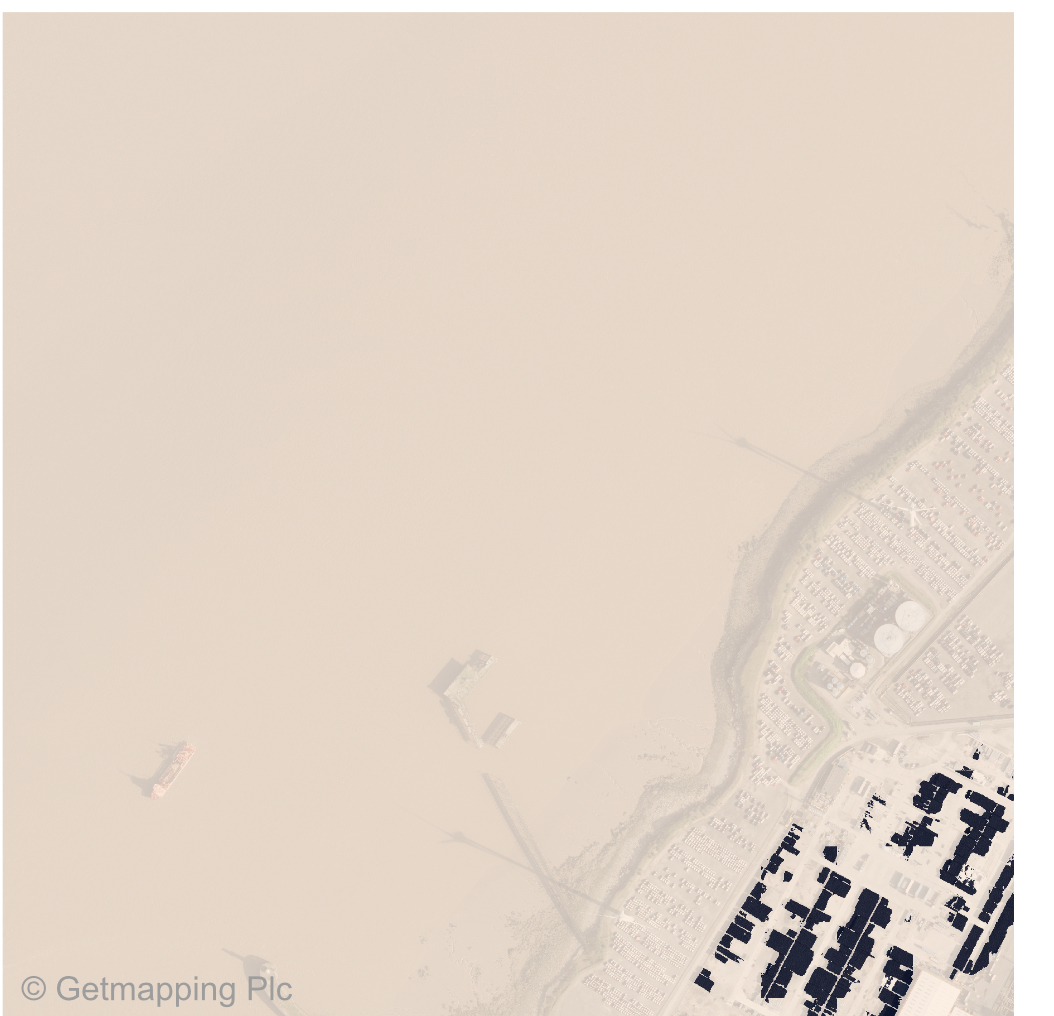
Bristol docks confused the model
Alternative methods for geospatial ML
Get involved!
Is your curiosity piqued?
Do you want to contribute to climate related tech projects?
Thank you
I'm building continuous integration tools for data science teams at treebeard.io
If you do some kind of data science, I'd love to hear from you!
Say hi: laurence@treebeard.io
Twitter: @LaurenceWWatson
Code
Data wrangling: https://github.com/Rabscuttler/esda-dissertation
RasterVision scripts: https://github.com/Rabscuttler/raster-vision/tree/master/code
Coordinate systems
        import geopandas as gpd
        gb_outline = gpd.read_file('greatbritain.shp')
        gb_outline.plot(figsize=(8,8))
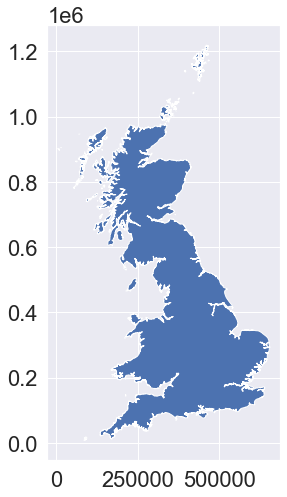
Coordinate systems
gb_outline.crs
        Projected CRS: EPSG:27700
        Name: OSGB 1936 / British National Grid
        Axis Info [cartesian]:
        - E[east]: Easting (metre)
        - N[north]: Northing (metre)
        Area of Use:
        - name: UK - Britain and UKCS 49°46'N to 61°01'N, 7°33'W to 3°33'E
        - bounds: (-9.2, 49.75, 2.88, 61.14)
        Coordinate Operation:
        - name: British National Grid
        - method: Transverse Mercator
        Datum: OSGB 1936
        - Ellipsoid: Airy 1830
        - Prime Meridian: Greenwich
Coordinate systems
gb_outline.to_crs(crs={'init':'epsg:4326'}).plot()
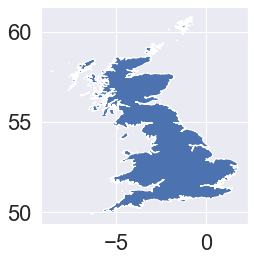
Coordinate systems
wgs(gb_outline).crs
        Geographic 2D CRS: +init=epsg:4326 +type=crs
          Name: WGS 84
          Axis Info [ellipsoidal]:
          - lon[east]: Longitude (degree)
          - lat[north]: Latitude (degree)
          Area of Use:
          - name: World
          - bounds: (-180.0, -90.0, 180.0, 90.0)
          Datum: World Geodetic System 1984
          - Ellipsoid: WGS 84
          - Prime Meridian: Greenwich
Web Mercator
General lack of understanding that the Web Mercator differs from standard Mercator usage has caused considerable confusion and misuse. For all these reasons, the United States Department of Defense through the National Geospatial-Intelligence Agency has declared this map projection to be unacceptable for any official use.