Curated voting data, visualising MEP groupings, scoring your local MEP
It began at a hackathon weekend in Brussels, focusing on European democracy ahead of the 2015 elections. Three of us pulled together a basic project that gave each MEP a score in one policy area, based on a selection of votes made in the European Parliament.
It ended up as Score-Ep.org, with input from 5 different campaign groups scoring MEPs from all European countries on climate change, fracking, GM crops, the Arms Trade and LGBT Issues.
I think the key added value for this project is that there are a huge amounts of parliamentary votes (in the EU and at national level) and unless you are following closely it is very difficult to work out i) which bills and ii) which amendments are the key ones, and whether a vote for or against is aligned with your views. So, the answer is just to filter the data via some experts, and not unbiased ones either - ones with a clear view on a certain issue. By passing the duty of analysing key votes to them, we can get a good idea of voting patterns on a given issue.
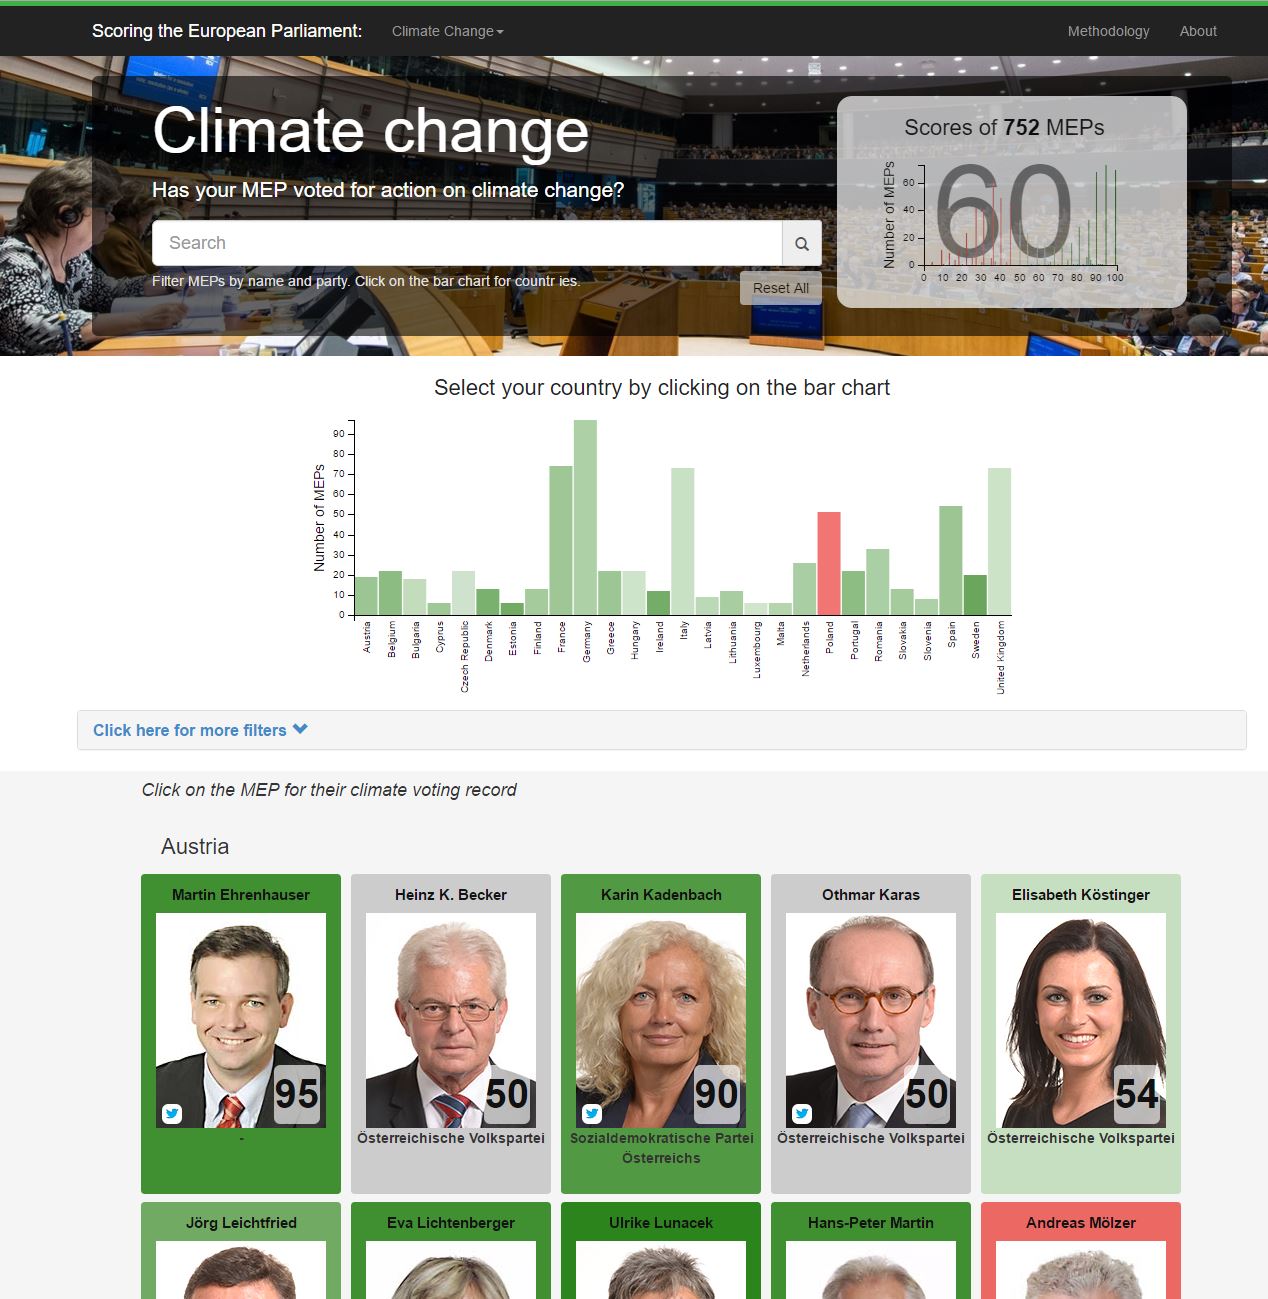
After selecting a topic, you were presented with the data for every MEP, and an option to select a single country or combination of countries.

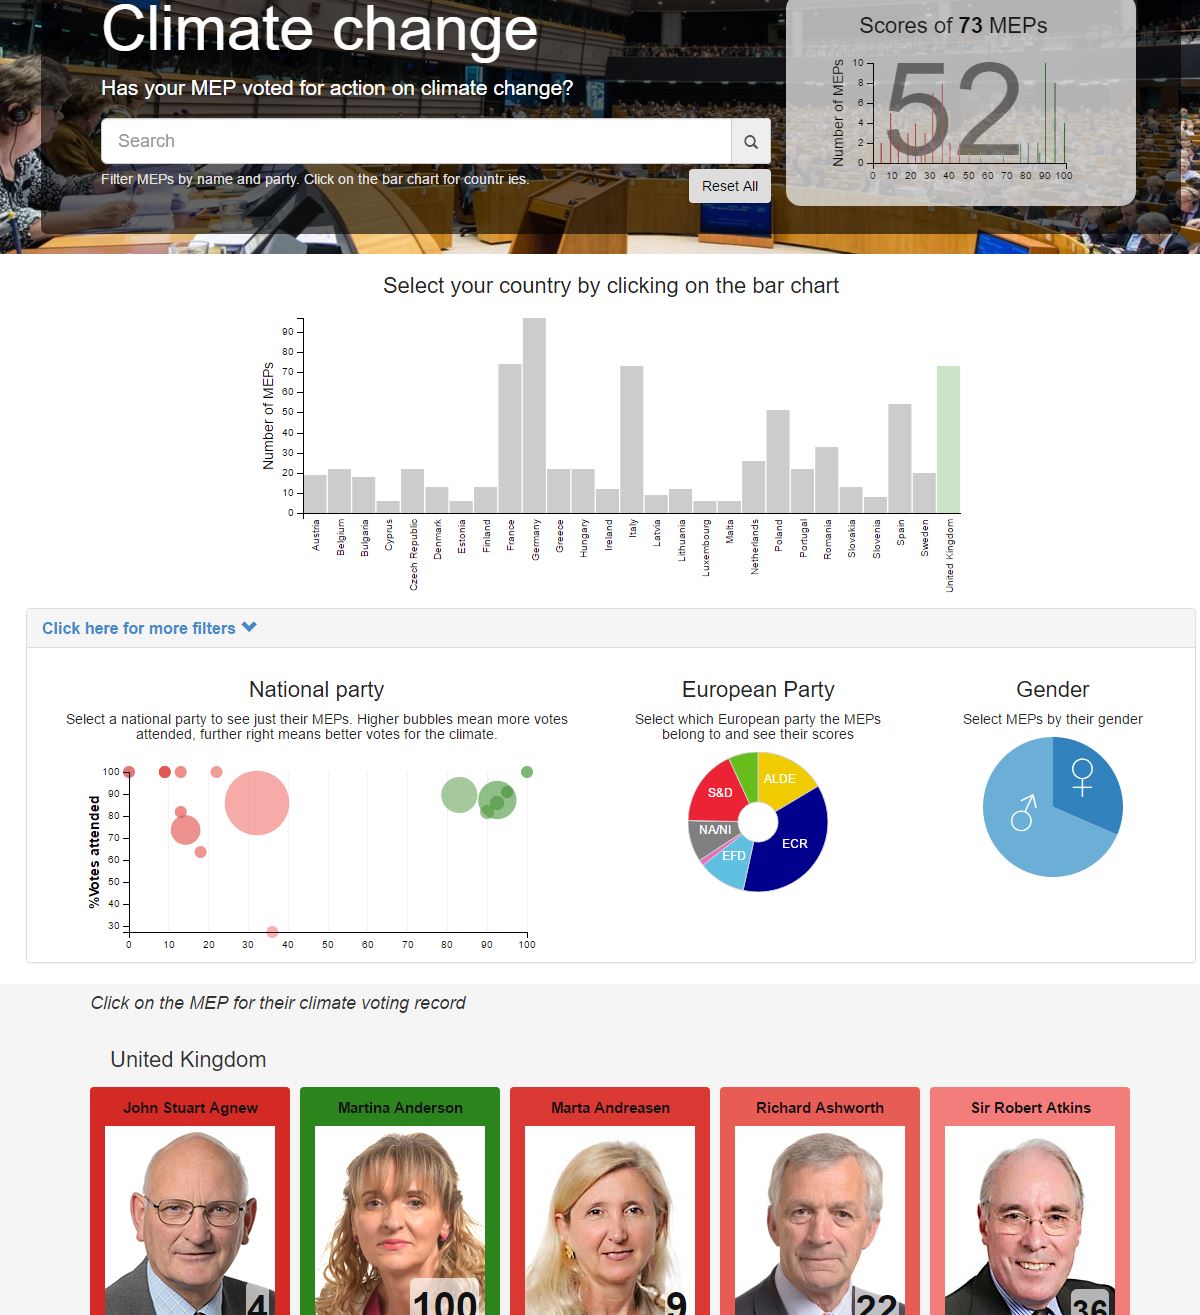
A selection would reveal a further information breakdown.

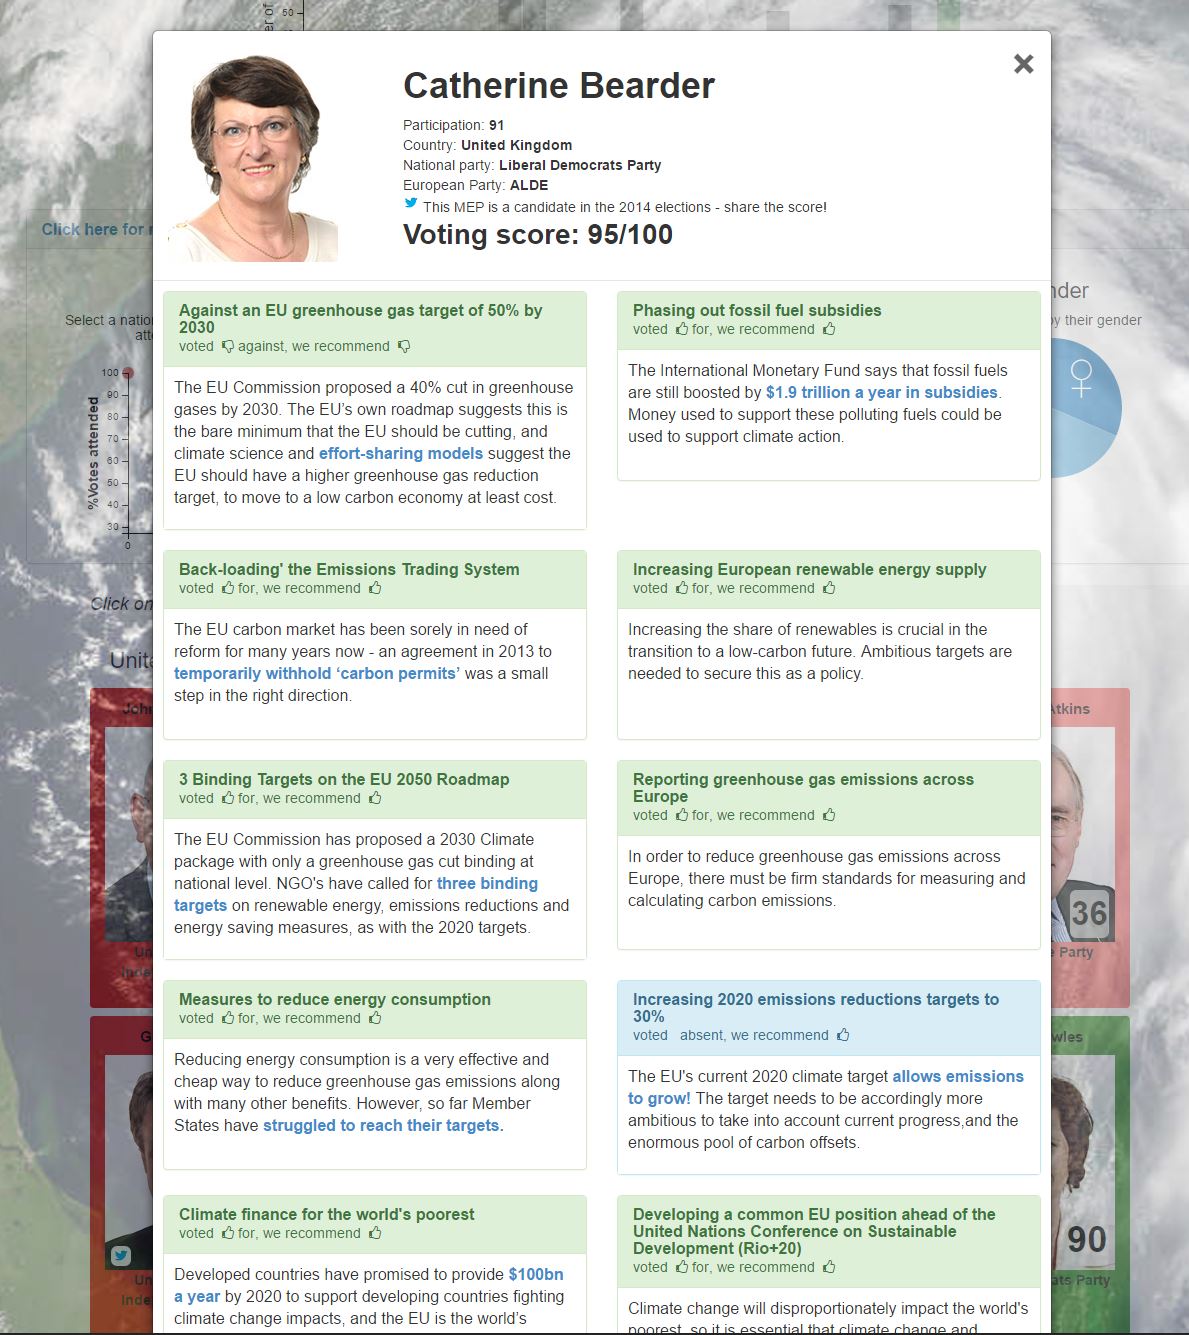
Selecting a single MEP shows the votes they have been scored on.

It’s very interactive so the best way to explore it is to have a play yourself! Try selecting one country and then toggling another to see how aligned the breakdowns are. Or explore whether male or female MEPs are more protective of the climate.
Many thanks to Joachim Gola and Michal Škop for getting the ball rolling originally.
Huge praise to Xavier Dutoit for organising the original hackathon and building this project with me - Xavier is a dataviz whizz and a champion for democracy.